. 2016 Oct 18;17(4):1193-1205.
doi: 10.1016/j.celrep.2016.09.079.

A CRISPR Dropout Screen Identifies Genetic Vulnerabilities and Therapeutic Targets in Acute Myeloid Leukemia

Affiliations

A CRISPR Dropout Screen Identifies Genetic Vulnerabilities and Therapeutic Targets in Acute Myeloid Leukemia

Konstantinos Tzelepis et al. Cell Rep. .

Abstract

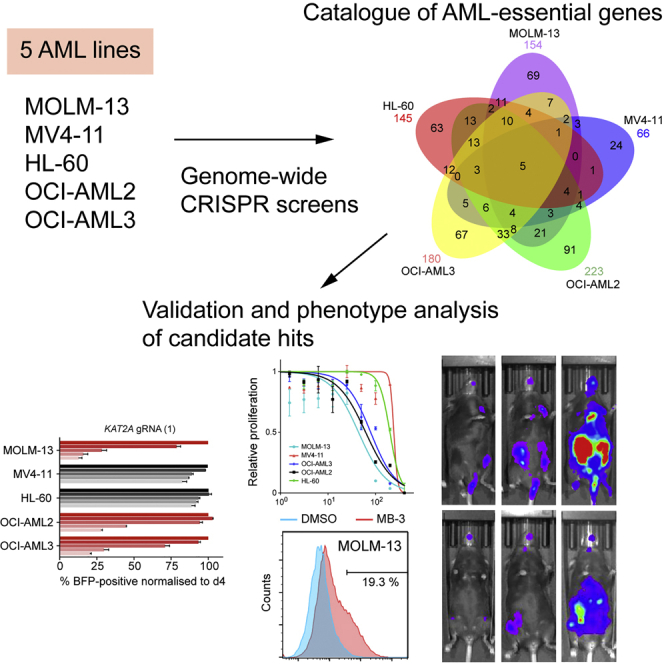
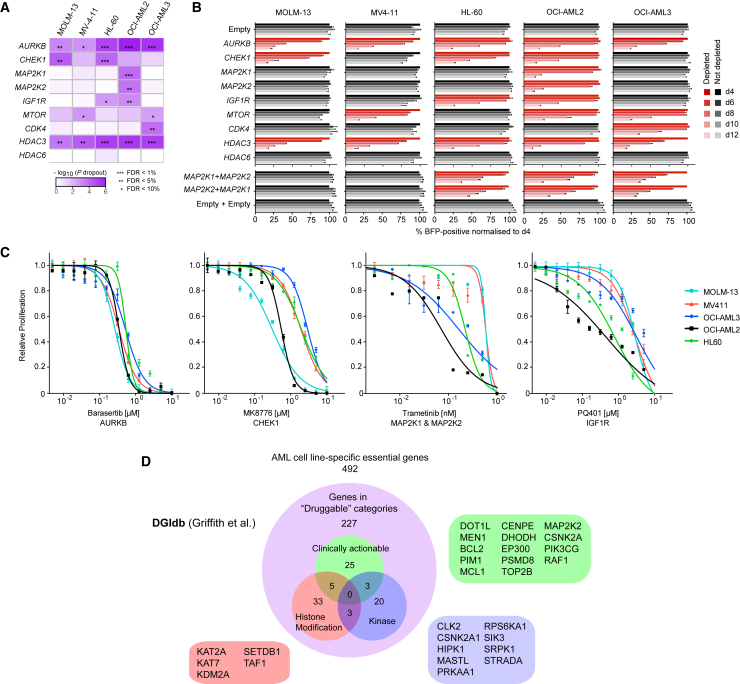
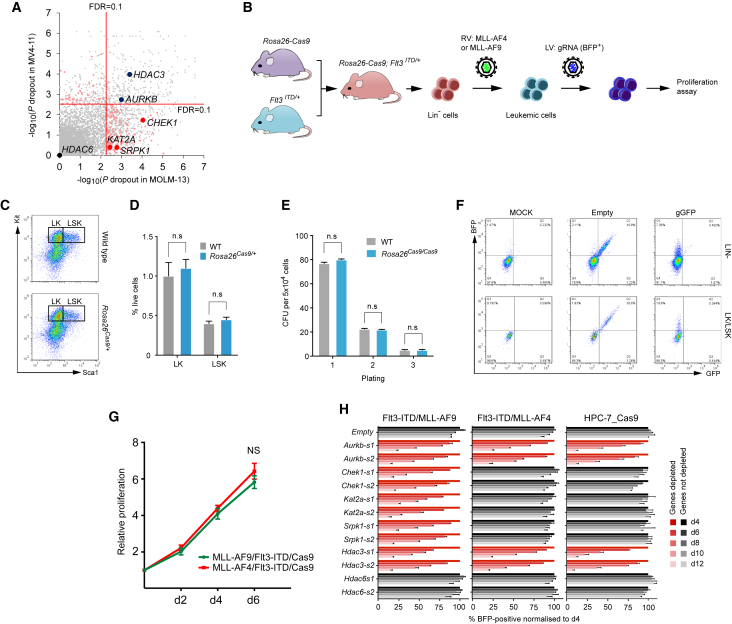
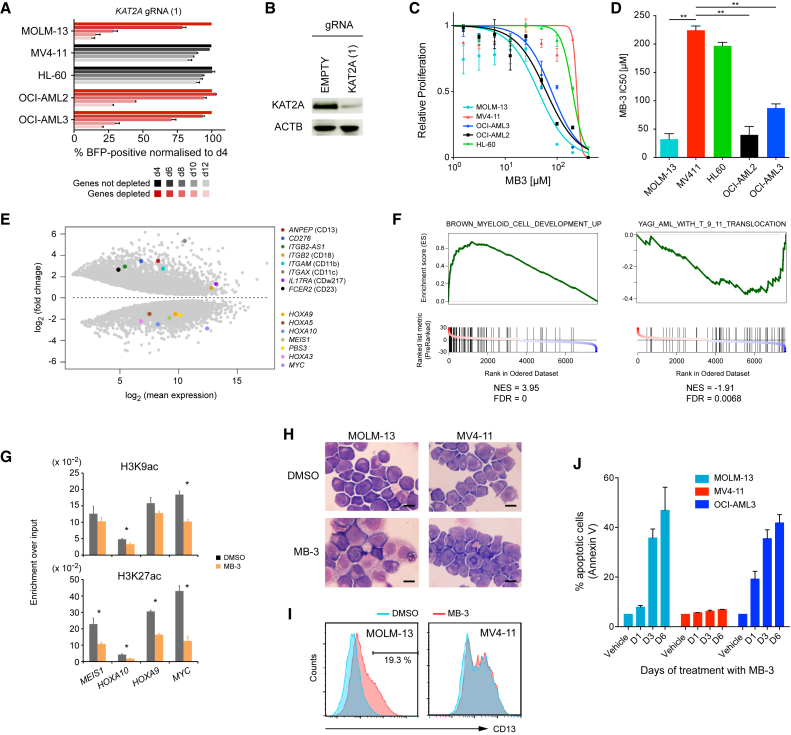
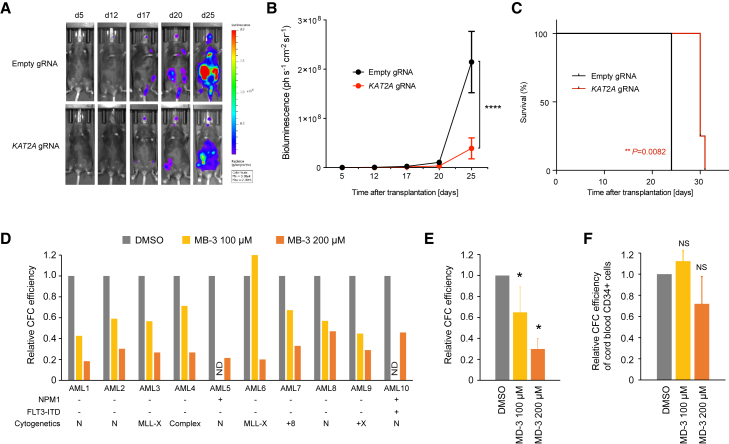
Acute myeloid leukemia (AML) is an aggressive cancer with a poor prognosis, for which mainstream treatments have not changed for decades. To identify additional therapeutic targets in AML, we optimize a genome-wide clustered regularly interspaced short palindromic repeats (CRISPR) screening platform and use it to identify genetic vulnerabilities in AML cells. We identify 492 AML-specific cell-essential genes, including several established therapeutic targets such as DOT1L, BCL2, and MEN1, and many other genes including clinically actionable candidates. We validate selected genes using genetic and pharmacological inhibition, and chose KAT2A as a candidate for downstream study. KAT2A inhibition demonstrated anti-AML activity by inducing myeloid differentiation and apoptosis, and suppressed the growth of primary human AMLs of diverse genotypes while sparing normal hemopoietic stem-progenitor cells. Our results propose that KAT2A inhibition should be investigated as a therapeutic strategy in AML and provide a large number of genetic vulnerabilities of this leukemia that can be pursued in downstream studies.

Keywords: AML; CRISPR; KAT2A; MB-3; acute myeloid leukemia; genetic screen; genetic vulnerability.


Figures

None
Graphical abstract
Figure 1
Figure 1
Optimization of CRISPR Dropout Screens and Validation (A–D) Results of dropout screens in mouse ESCs (A and C) and nucleotide-level biases on gRNA efficiency (B and D) identified with version 1 (v1; A and B) and version 2 (v2; C and D) of the mouse genome-wide CRISPR libraries. (E–G) Comparisons between gRNA counts (E) or gene-level significance of dropout and gene expression (F and G). An RNA-seq dataset (GSE44067; Zhang et al., 2013) was used and a cutoff of 0.5 FPKM was applied to distinguish expressed and non-expressed genes. The vast majority of gRNAs targeting non-expressed genes (E, left panel) exhibited equal representation between plasmid and day 14 mouse ESCs, indicating that the library complexity was maintained and that off-target effects were negligible. By contrast, a significant number of expressed genes are under- or over-represented in surviving day 14 ESCs. This is also evident at the gene-level analysis (F and G). The Kolmogorov-Smirnov test was used in (G). See also Figure S1, Table S1, and Data S1.
Figure 2
Figure 2
Validation of the Human CRISPR Library in the HT-29 Colon Cancer Cell Line (A) Effects of copy numbers on dropout efficiency in human colon cancer cell line, HT-29. Genes that were significantly depleted at day 25 (FDR < 10%) were grouped according to their copy number. (B) Depletion p values (top) and copy number (bottom) of genes on chromosomes 8 and 20. Note that an eight-copy region containing Myc shows a clear distinction in the depletion pattern. Copy number data in HT-29 were obtained from the Catalogue of Somatic Mutations in Cancer (COSMIC) cell line database (http://cancer.sanger.ac.uk/cell_lines/). (C and D) Hierarchical clustering of gene depletion. Genes that were significantly depleted on day 25 (FDR < 10%) were analyzed. (E) Representative gene sets enriched in early intermediate- and late-depletion groups. The full list can be found in Table S2. The Kolmogorov-Smirnov test was used in (A). See also Figures S1–S3, Tables S1, S2, and S3, and Data S2.
Figure 3
Figure 3
Identification of AML-Cell-Line-Specific Essential Genes (A) Numbers of depleted genes in each of the seven cancer cell lines screened according to FDRs. (B) Venn diagram depicting AML-cell-line-specific cell-essential genes defined as those depleted in at least one AML cell line and not in HT-1080 or HT-29. (C) Gene ontology analysis of the 66 genes essential to three or more AML cell lines. (D) Depletion of five gRNA against MLL according to their location relative to the MLL breakpoint region. (E) Depletion of the FLT3, NRAS, and NPM1 genes affected by known oncogenic mutations in the specified AML cell lines and of BCL2, which was depleted in all AML cell lines except OCI-AML3, which carries a frameshift mutation in BAX. See also Figures S4 and S5, Table S3, and Data S2.
Figure 4
Figure 4
Genetic and Pharmacological Validation of Screen Hits (A) Significance levels for cell essentiality of selected genes in AML cell lines from our dropout screens. (B) Validation of the findings of the screen using a 12-day competitive co-culture assay. Cells were transduced with lentivirus expressing one of two gRNAs per gene, and the BFP-positive fraction was compared with the non-transduced population. Results were normalized to day 4 for each gRNA. Data are shown as mean ± SD (n = 2). The full dataset can be found in Figure S5N. (C) Effects of selected clinical inhibitors on cell growth. The results were normalized to DMSO-treated cells from each cell line cultured in parallel. Data are shown as mean ± SD (n = 3). (D) Drug Gene Interaction database (DGIdb) (Griffith et al., 2013) categorization of AML-specific cell-essential genes into “druggable” categories defined by the DGIdb. Three categories are depicted. Full categorization can be found in Table S4. In the druggable set, representative genes in each of the three categories are listed. See also Figure S5 and Tables S4 and S6.
Figure 5
Figure 5
Differential Vulnerabilities between MLL-AF4- and MLL-AF9-Driven Leukemias (A) Comparison of dropout p values between MOLM-13 and MV4-11. AURKB and HDAC3 were significantly depleted in both lines, but HDAC6 was not in either line. In contrast, CHEK1, KAT2A, and SRPK1 were depleted only in MOLM-13. Genes that are specifically depleted in either cell line (FDR < 0.1) but not in either non-AML cell line are highlighted in pale red. (B) Schematic of CRISPR-based validation of genotype-specific essentialities using ex vivo mouse leukemia model. (C and D) Normal percentages of LK (Lin/Kit+) and LSK (Lin/Sca1+/Kit+) hemopoietic stem-progenitor cells were identified in the bone marrow of Rosa26Cas9/+ mice. Data are shown as mean ± SD (n = 3). (E) Colony-forming assays of bone marrow cells derived from WT and Rosa26Cas9/Cas9 mice, showing no differences in replating ability of Rosa26Cas9/Cas9 cells compared with WT. (F) Validation of Cas9 activity in Lin or LK/LSK cells from Rosa26Cas9/+ mice using the Cas9 activity reporter. (G) Growth kinetics of primary Lin cells from Flt3ITD/+;Rosa26Cas9/+ mice transformed with a retrovirus expressing MLL-AF4 or MLL-AF9. Data are shown as mean ± SD (n = 4). (H) Competitive co-culture assay showing oncogene-specific vulnerabilities in the ex vivo leukemia model. As a normal cell control, non-leukemic HPC-7 mouse hematopoietic cells were used. Results were normalized to day 4 for each gRNA. Data are shown as mean ± SD (n = 3). The Student’s t test was performed in (D) and (E). Two-way ANOVA was performed in (G). See also Figure S6 and Table S6.
Figure 6
Figure 6
KAT2A Suppression Induces Myeloid Differentiation and Apoptosis (A) CRISPR-based validation of KAT2A depletion in the five AML cell lines. Full results can be found in Figure S5N. (B) Western blot analysis of KAT2A expression in MOLM-13 targeted by KAT2A-specific gRNA. (C and D) Drug response (C) and 50% inhibitory concentration (IC50) values (D) of the five AML cell lines treated with the KAT2A inhibitor MB-3. (E) Differentially expressed genes in MB-3-treated MOLM-13. AML program genes (downregulated) and myeloid marker genes (upregulated) are highlighted. (F) Gene set enrichment analysis (GSEA) showing significant enrichment for the AML program and myeloid differentiation. (G) Histone H3 acetylation status of genes downregulated by MB-3 treatment using ChIP-qPCR assay. (H and I) Microscopic (H) and flow cytrometric (I) analyses of myeloid differentiation after 24-hr treatment with 100 μM MB-3. No changes were observed in MB-3-insensitive MV4-11 cells. Scale bar, 10 μm. (J) Increased apoptosis after treatment with 100 μM MB-3. Data are shown as mean ± SD (n = 3 in C, D, and J; n = 2 in G). The Student’s t test was performed in (D) and (G). p < 0.05; ∗∗p < 0.01. See also Figure S5 and Table S6.
Figure 7
Figure 7
KAT2A Inhibition Shows Suppression of Leukemic Cell Growth In Vivo and Human Primary AML Cells (A) Bioluminescence imaging of mice transplanted luciferase-labeled gRNA-transduced MOLM-13 cells at indicated time points. (B) Quantification of luminescence. ∗∗∗∗p < 0.0001. (C) Kaplan-Meier plot showing survival of mice transplanted with MOLM-13 expressing the indicated gRNA. Log rank test was performed. (D and E) Colony-forming cell (CFC) assay of 10 primary AMLs of diverse genotypes with 100 and 200 μM MB-3. Detailed information can be found in Table S5. Mean values of 10 samples are shown in (E). Error bars represent SD. p < 0.05. (F) CFC efficiency of CD34+ human cord blood cells (n = 4). The Student’s t test was performed in (B), (E), and (F). See also Table S5. N, normal karyotype; ND, not determined.

References

    1. Bernt K.M., Zhu N., Sinha A.U., Vempati S., Faber J., Krivtsov A.V., Feng Z., Punt N., Daigle A., Bullinger L. MLL-rearranged leukemia is dependent on aberrant H3K79 methylation by DOT1L. Cancer Cell. 2011;20:66–78. - PMC - PubMed
    1. Beroukhim R., Mermel C.H., Porter D., Wei G., Raychaudhuri S., Donovan J., Barretina J., Boehm J.S., Dobson J., Urashima M. The landscape of somatic copy-number alteration across human cancers. Nature. 2010;463:899–905. - PMC - PubMed
    1. Biel M., Kretsovali A., Karatzali E., Papamatheakis J., Giannis A. Design, synthesis, and biological evaluation of a small-molecule inhibitor of the histone acetyltransferase Gcn5. Angew. Chem. Int. Ed. Engl. 2004;43:3974–3976. - PubMed
    1. Bignell G.R., Greenman C.D., Davies H., Butler A.P., Edkins S., Andrews J.M., Buck G., Chen L., Beare D., Latimer C. Signatures of mutation and selection in the cancer genome. Nature. 2010;463:893–898. - PMC - PubMed
    1. Boutros M., Ahringer J. The art and design of genetic screens: RNA interference. Nat. Rev. Genet. 2008;9:554–566. - PubMed

Publication types

MeSH terms

Substances