. 2016 Oct 18;45(4):861-876.
doi: 10.1016/j.immuni.2016.09.014.

Macrophage Epithelial Reprogramming Underlies Mycobacterial Granuloma Formation and Promotes Infection

Affiliations

Macrophage Epithelial Reprogramming Underlies Mycobacterial Granuloma Formation and Promotes Infection

Mark R Cronan et al. Immunity. .

Abstract

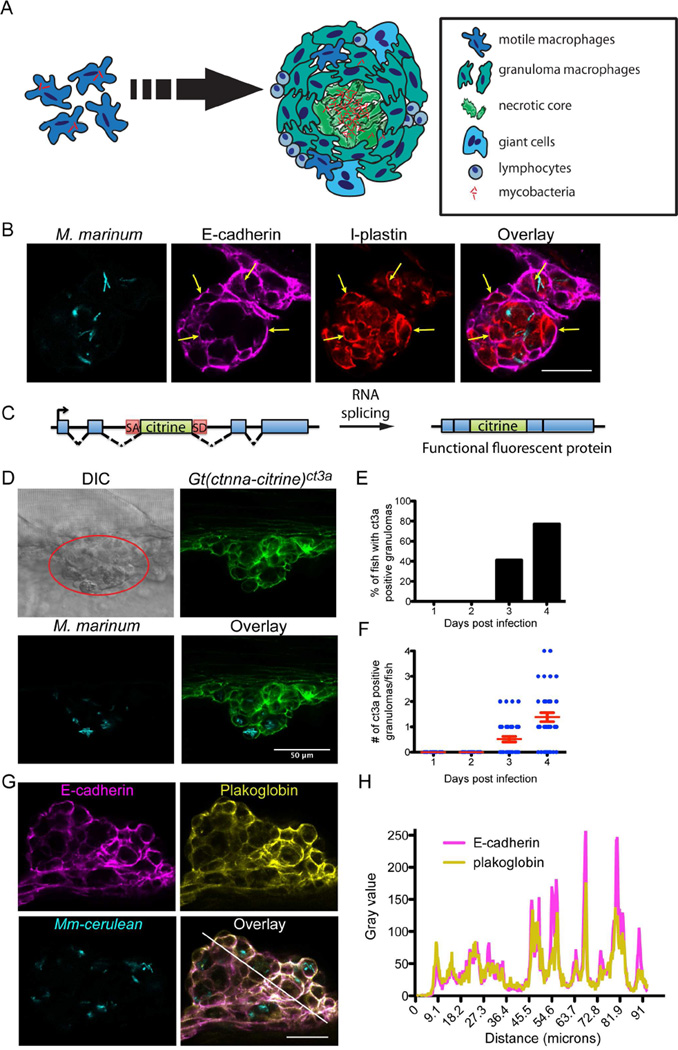
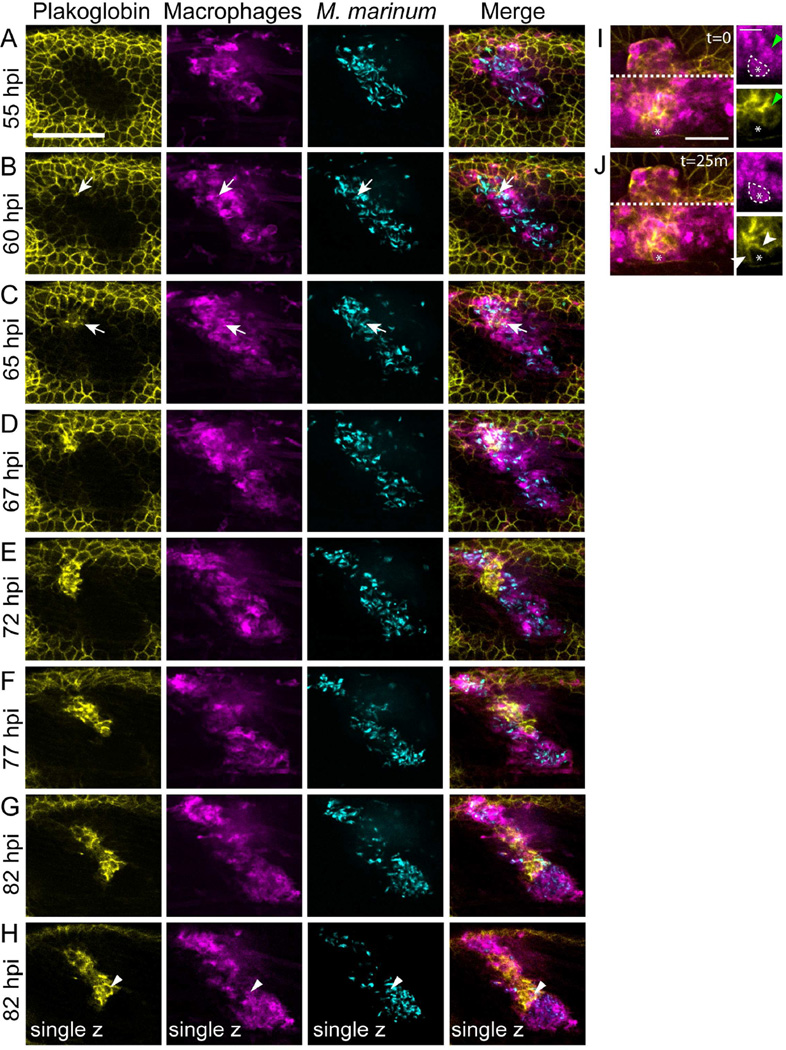
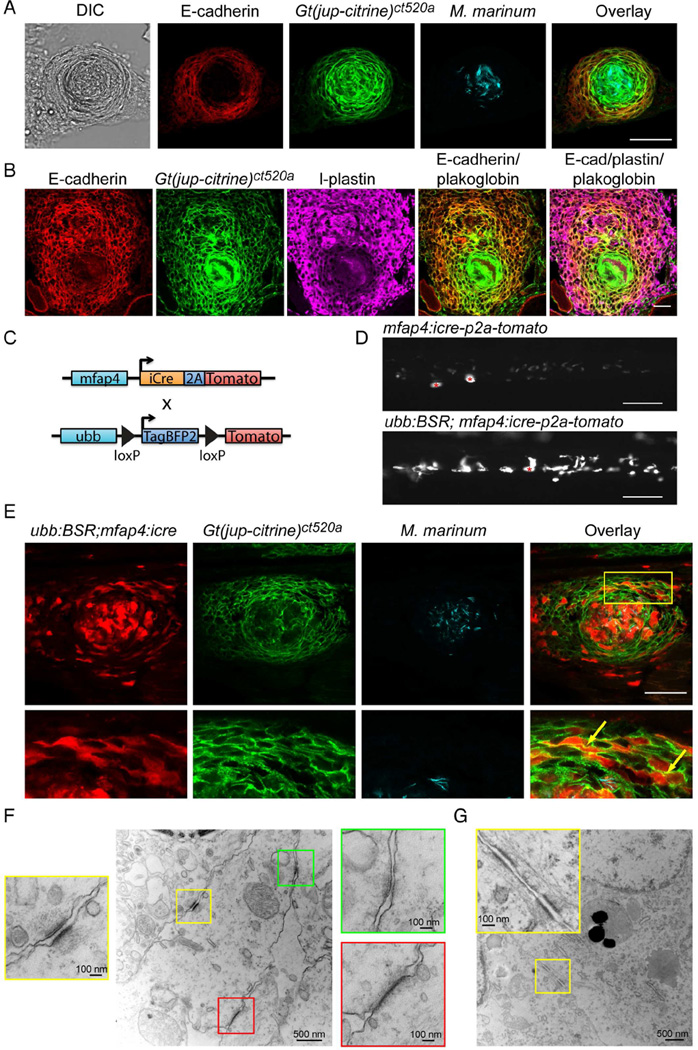
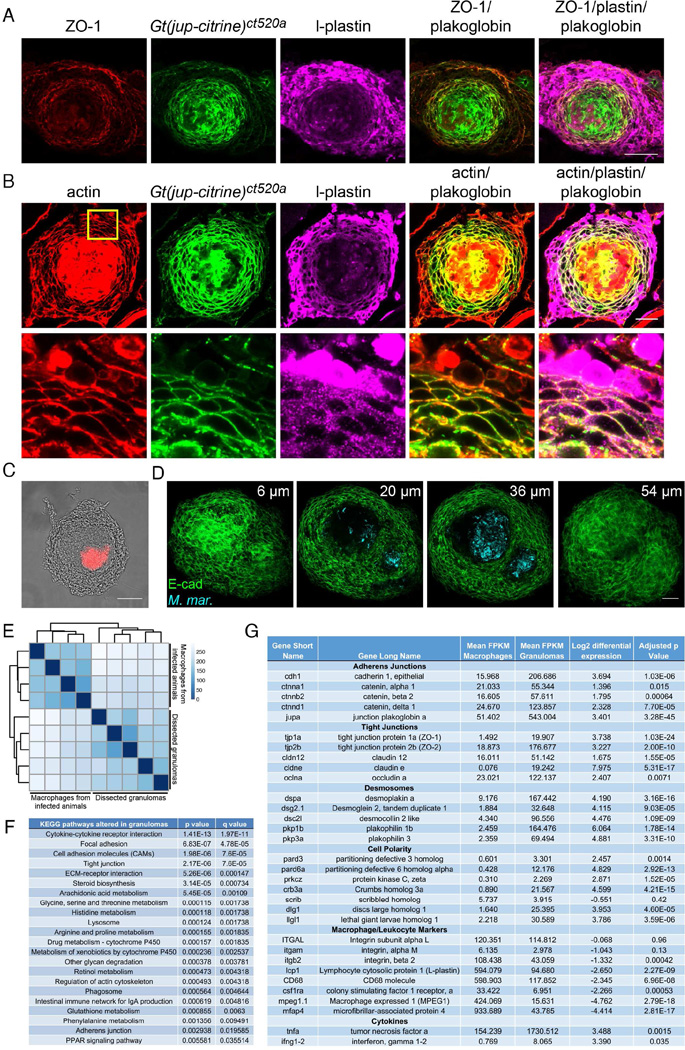
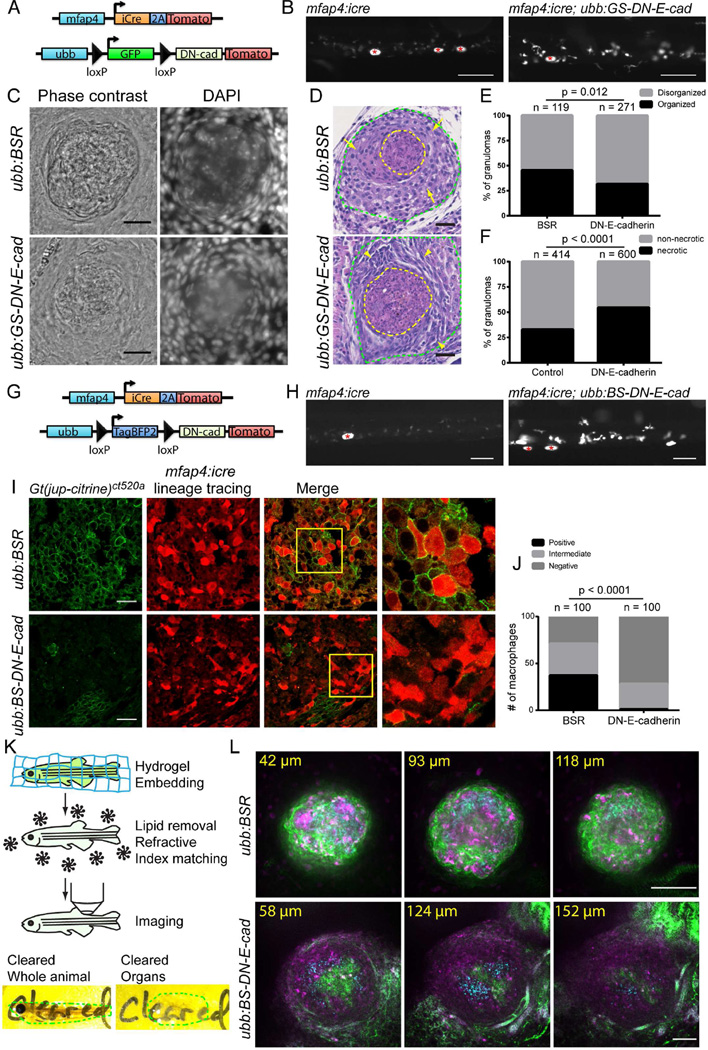
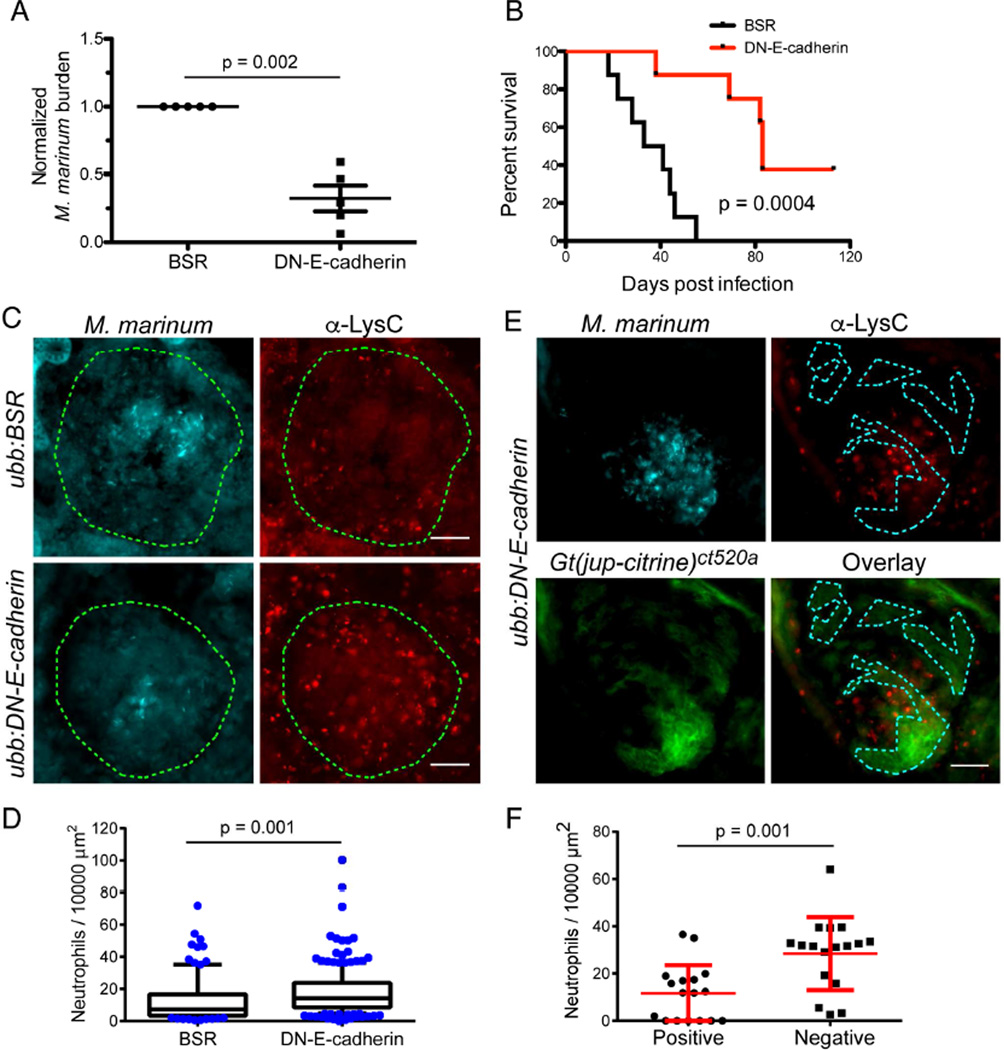
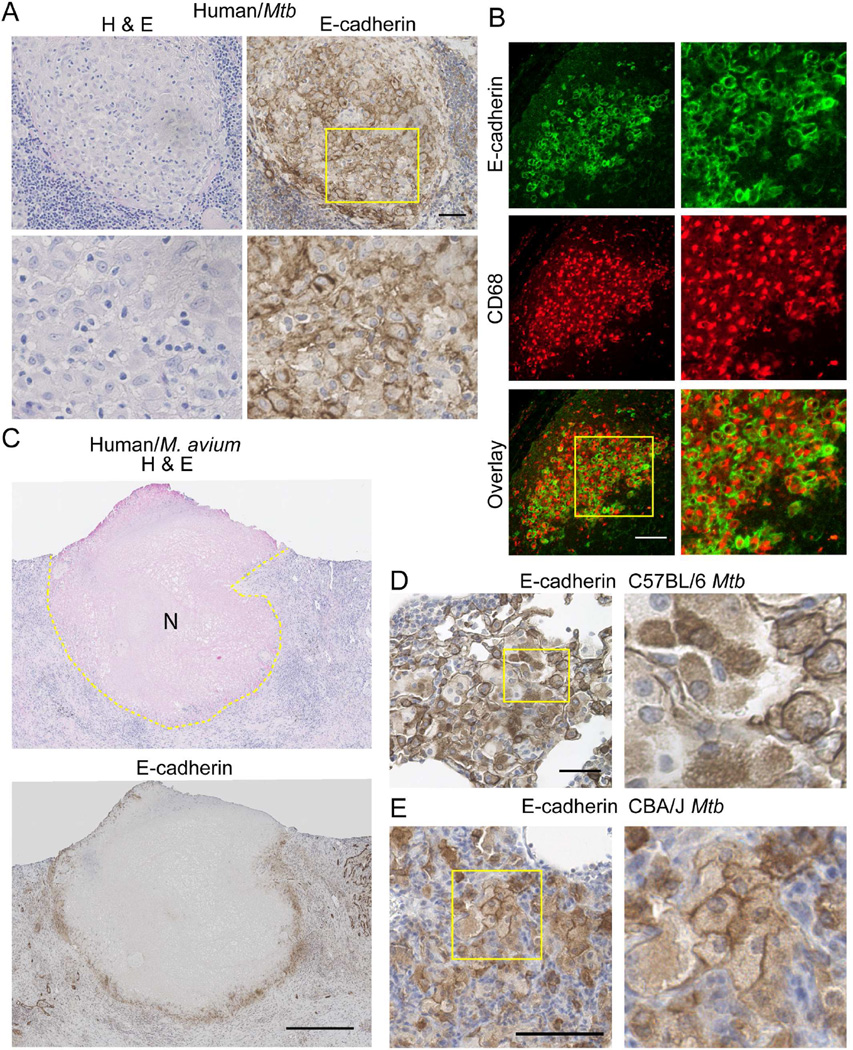
Mycobacterium tuberculosis infection in humans triggers formation of granulomas, which are tightly organized immune cell aggregates that are the central structure of tuberculosis. Infected and uninfected macrophages interdigitate, assuming an altered, flattened appearance. Although pathologists have described these changes for over a century, the molecular and cellular programs underlying this transition are unclear. Here, using the zebrafish-Mycobacterium marinum model, we found that mycobacterial granuloma formation is accompanied by macrophage induction of canonical epithelial molecules and structures. We identified fundamental macrophage reprogramming events that parallel E-cadherin-dependent mesenchymal-epithelial transitions. Macrophage-specific disruption of E-cadherin function resulted in disordered granuloma formation, enhanced immune cell access, decreased bacterial burden, and increased host survival, suggesting that the granuloma can also serve a bacteria-protective role. Granuloma macrophages in humans with tuberculosis were similarly transformed. Thus, during mycobacterial infection, granuloma macrophages are broadly reprogrammed by epithelial modules, and this reprogramming alters the trajectory of infection and the associated immune response.


Figures

Figure 1
Figure 1. Mycobacterial Granulomas in Larvae Induce Expression of Epithelial Markers
(A) Cartoon of granuloma formation depicting macrophage aggregation and morphological rearrangement to an interdigitated, flattened epithelial appearance. (B) M. marinum (cyan) granulomas stained for E-cadherin (magenta) and l-plastin (red) at 4 dpi in larva infected with 250 fluorescent M. marinum. Scale bar – 25 µm. (C) Schematic of gene trap approach used in generating the Gt(ctnna-citrine)ct3a and Gt(jup-citrine)ct520azebrafish lines: an exogenous citrine ORF flanked with a splice donor site (SD) and splice acceptor (SA) is introduced into the endogenous ctnna and jup genes. (D) Granulomas were identified by DIC imaging (red circle). Fluorescent imaging demonstrating localization of Gt(ctnna-citrine)ct3a fusion protein (green) at adherens junctions formed in M. marinum (cyan) larval granulomas at 4 dpi. Scale bar – 50 µm. (E and F) Quantitation of Gt(ctnna-citrine)ct3a positive granulomas from 1–4 dpi in larval zebrafish infected with 150–250 fluorescent bacteria (FB)/fish M. marinum n = 39, representative of 3 independent experiments. (E) Percentage of fish with at least one Gt(ctnna-citrine)ct3a positive granuloma by day. (F) Number of Gt(ctnna-citrine)ct3a positive granulomas per fish. Each dot represents one fish. Bars represent mean ± SEM. (G) Fluorescent images of a 4 dpi larval granuloma showing E-cadherin staining (magenta) colocalized with plakoglobin (yellow) in a granuloma in M. marinum (cyan)-infected zebrafish. Fish were infected with 150–250 FB/fish. Scale bar – 25 µm. Images representative of results from 12 animals. (H) Plakoglobin and E-cadherin fluorescence intensity as a function of distance was measured along the white line in (G), demonstrating colocalization of E-cadherin fluorescence with plakoglobin. See also Figure S1.
Figure 2
Figure 2. Live Imaging of Adherens Junction Formation within Macrophages of the Developing Granuloma
Tg(mfap4:tomato-caax); Gt(jup-citrine)ct520a animals were infected with 150–250 FB/fish and imaged from 48 hours post infection (hpi) to 96 hpi to visualize adherens junction formation during granuloma formation. (A–G) The image in each panel is a maximum projection of a 28 µm z-stack. Arrows indicate the site of initial adherens junction formation within the granuloma. Scale bar – 100 µm. (H) single z-plane image from 82 hpi timepoint demonstrating plakoglobin adherens junction formation within granuloma macrophages. Arrowheads indicate a plakoglobin-positive infected macrophage in single plane image. Gamma adjustments were applied uniformly across all images to facilitate display. Note – the initial plakoglobin signal surrounding the granuloma is the larval skin within the imaging planes. (I) and (J) Images of a granuloma in another Tg(mfap4:tomato-caax); Gt(jup-citrine)ct520a animal demonstrating formation of adherens junctions (plakoglobin, yellow) between adjacent macrophages (magenta). (I) A plakoglobin-negative approaching macrophage (white dotted line, asterisk) contacts a plakoglobin-positive macrophage (green arrowheads). (J) 25 minutes later, the macrophage relocalizes plakoglobin to the cell surface (white arrowheads). Scale bar – 100 µm in main image, 50 µm in inset. See also Movies S1 and S2.
Figure 3
Figure 3. Granuloma Epithelialization Occurs within Macrophages and Involves Multiple Adhesive Pathways
(A) E-cadherin was detected by immunofluorescence (red) and colocalized with endogenous Gt(jup-citrine)ct520a (green) in granulomas in 2 wpi M. marinum (cyan) infected animals. Scale bar – 50 µm. (B) E-cadherin staining (red) and plakoglobin fluorescence (green) within cell populations that are positive for the pan-leukocyte marker l-plastin (magenta) in granulomas from 2 wpi animals. Scale bar – 25 µm. (C) Diagram of lineage tracing approach used to label macrophages. (D) Images of tdTomato expression in animals expressing either macrophage-specific Cre alone (Tg(mfap4:icre-p2a-tomato)) or double transgenic animals in which macrophage specific Cre rearranges the blue-to-red lineage tracing cassette (Tg(ubb:BSR; mfap4:icre)), resulting in robust red fluorescence from the reporter cassette. Asterisks mark autofluorescent melanocytes. Scale bar – 100 µm. (E) A necrotic granuloma in a 2 wpi Tg(mfap4:icre; ubb:BSR); Gt(jup-citrine)ct520a animal infected with 400 FB of cerulean-tagged mycobacteria. Images show macrophages (red) localizing to plakoglobin positive adherens junctions (green); infecting mycobacteria are visualized in cyan. Yellow box indicates magnified areas shown in the row below. Images are representative of granulomas from 12 animals. Scale bar – 50 µm. (F) Electron microscopy images of desmosomes (yellow box), adherens junctions (green box) and tight junctions (red box) in granuloma macrophages in M. marinum infected 2 wpi Tg(mfap4:icre; ubb:BSR) zebrafish. (G) Image of desmosomes in 2 wpi Tg(mfap4:icre; ubb:BSR) zebrafish. Note in inset the filament network associated with desmosomes. See also Figure S2 and S3.
Figure 4
Figure 4. Granuloma Formation is Accompanied by Diverse Changes in Macrophage Cytoskeleton and Gene Expression
(A) ZO-1 immunofluorescence (red) localized within the plakoglobin (green) positive region surrounding the granuloma necrotic core in l-plastin positive cells (magenta) in 2 wpi M. marinum infected animals at an initial dose of 400 FB. Results representative of granulomas in 4 animals. Scale bar – 50 µm. (B) Actin (red) and plakoglobin (Gt(jup-citrine)ct520a, green) localization within the l-plastin (magenta) positive cells of the granuloma. Cortical reorganization of actin occurs within l-plastin positive granuloma cells that have cell-surface localized plakoglobin. Yellow box indicates area magnified in bottom panel. Representative of results from 4 animals. (C) Phase contrast image of a granuloma dissected from a 2 wpi zebrafish infected with 400 FB of M. marinum. M. marinum fluorescence overlaid in red on the phase contrast image. Scale bar – 100 µm. (D) Dissected, CLARITY-cleared granuloma stained for E-cadherin (green) from a 2 wpi M. marinum (cyan) infected animal. (E) Hierarchical clustering of expression data from dissected granulomas and kidney macrophages from infected animals. Darker colors on the heat map indicate samples with more closely related transcriptomes. (F) Most differentially regulated pathways in granulomas relative to kidney macrophages from infected animals. (G) Expression changes between kidney macrophages and granulomas in selected adhesion, polarity and immune marker genes. Mean transcript expression levels are calculated as fragments mapped per kilobase of exon per million fragments mapped (FPKM). Differential expression values are calculated as Log2(granuloma/macrophages). More complete tables of pathway components available in Table S1 and within the complete dataset in Table S2. See also Figures S3 and S4.
Figure 5
Figure 5. Cadherin-dependent Adherens Junctions Promote Granuloma Organization
(A) Schematic of lineage tracing approach used to drive DN-E-cadherin within macrophages. (B) Images of tomato expression in Tg(mfap4:icre) and Tg(mfap4:icre; ubb:GS-DN-e-cadherin) animals showing increased tomato expression in Tg(mfap4:icre; ubb:GS-DN-e-cadherin) animals relative to Tg(mfap4:icre) animals, indicative of rearrangement of the lineage tracing DN-E-cadherin cassette. Asterisks mark autofluorescent melanophores. Scale bar – 100 µm. (C) Images of 2 wpi M. marinum granulomas in Tg(mfap4:icre; ubb:BSR); Gt(jup-citrine)ct520a and Tg(mfap4:icre; ubb:GS-DN-e-cadherin) fish showing the morphology of granulomas by phase contrast and DAPI staining of granuloma nuclei. Animals were infected with 400 FB/fish M. marinum. Scale bar – 25 µm. (D) H&E stained sections from Tg(mfap4:icre; ubb:BSR); Gt(jup-citrine)ct520a and Tg(mfap4:icre; ubb:GS-DN-e-cadherin) demonstrating morphological alterations in DN-E-cadherin expressing animals. Sections from 2 wpi animals infected with 400 FB/fish M. marinum. Yellow dotted lines denote necrotic cores of individual granulomas. Green lines indicate regions of macrophages surrounding the necrotic core. Arrows indicate cells with classical epithelioid morphology within Tg(mfap4:icre; ubb:BSR) animals. Arrowheads mark groups of epithelioid macrophages with spindle morphology. Scale bars – 25 µM. (E–F) Quantitation of necrotic granulomas in pooled Tg(mfap4:icre; ubb:BSR); Gt(jup-citrine)ct520a and DN-E-cadherin expressing animals (mfap4:icre; ubb:GS-DN-e-cadherin and mfap4:icre; ubb:BS-DN-e-cadherin) from 3 experiments. (E) Organization of cells surrounding the necrotic core, visualized by brightfield as outlined in Figure S4D. P value determined by Fisher’s exact test and (F) The percentage of necrotic granulomas in each fish. Populations compared by Fisher’s exact test. (G) Schematic of lineage tracing approach used to drive rearrangement of the Tg(ubb:BS-DN-e-cadherin) construct leading to DN-E-cadherin expression in macrophages. (H) Images of Tg(mfap4:icre) and Tg(mfap4:icre; ubb:BS-DN-e-cadherin) animals demonstrating expression of DN-E-cadherin in macrophages through increased tomato fluorescence from the downstream 2A tomato cassette. Asterisks mark autofluorescent melanocytes. Scale bar – 100 µm. (I) Images of macrophage localization (red, mfap4:icre lineage tracing) and plakoglobin positive adherens junctions (green, Gt(jup-citrine)ct520a) of granulomas formed in control Tg(mfap4:icre; ubb:BSR); Gt(jup-citrine)ct520a and Tg(mfap4:icre; ubb:BS-DN-e-cadherin); Gt(jup-citrine)ct520a) animals. Boxes indicate regions of the merged image magnified in the images to the right. Scale bar – 25 µm. (J) Quantitation of plakoglobin expression within macrophages in non-necrotic granulomas from either control Tg(mfap4:icre; ubb:BSR); Gt(jup-citrine)ct520a or DN-E-cadherin expressing macrophages from Tg(mfap4:icre; ubb:BS-DN-e-cadherin); Gt(jup-citrine)ct520a animals. Macrophages were scored for plakoglobin positivity as outlined in experimental procedures. Quantitation from 5 granulomas in 2 animals each. Populations were compared by Chi square test. (K) Top - Cartoon of the steps of CLARITY-mediated tissue clearing in zebrafish. Bottom - images of cleared intact zebrafish and zebrafish organs. Dotted lines indicate the extent of the individual tissues. (L) Imaging of intact, CLARITY cleared granulomas in Tg(mfap4:icre; ubb:BSR); Gt(jup-citrine)ct520a and Tg(mfap4:icre; ubb:BS-DN-e-cadherin); Gt(jup-citrine)ct520a animals demonstrating loss of adherens junctions and organization in DN-E-cadherin animals. Green – plakoglobin, magenta – macrophages, M. marinum – cyan. Micron distances indicate the depth of each individual image relative to the top of the granuloma. Scale bar – 100 µm. For CLARITY images, gamma adjustment was performed uniformly for display. See also Figures S4 and S5 and Movies S3–S5.
Figure 6
Figure 6. Loss of Granuloma Adherens Junctions Reduces Bacterial Burden and Enhances Survival of Infected Animals
(A) Bacterial burden in Tg(mfap4:icre; ubb:BSR) and Tg(mfap4:icre; ubb:GS-DN-e-cadherin) animals was determined by CFU counts from whole animals at 2 wpi. Each point represents the mean of a single experiment with 5–8 surviving fish of each genotype in each experiment. Due to CFU variability between experiments, each experiment is presented normalized to control animals. Animals were infected with either 50 FB/fish or 400 FB/fish. Bars represent mean ± SEM. (B) Survival curves of Tg(mfap4:icre; ubb:BSR) and Tg(mfap4:icre; ubb:GS-DN-e-cadherin) animals infected with 400 FB/fish and followed longitudinally. Animals were monitored daily and moribund animals were euthanized. Statistical significance was determined by log-rank test. n = 8 for both Tg(mfap4:icre; ubb:BSR) and Tg(mfap4:icre; ubb:GS-DN-e-cadherin) groups. Experiments are representative of 3 independent experiments, additional experiments are displayed as Figures S5C and S5D. (C) M. marinum fluorescence (cyan) and neutrophil localization visualized by anti-LysC immunostaining (red) in Tg(mfap4:icre; ubb:BSR); Gt(jup-citrine)ct520a and Tg(mfap4:icre; ubb:BS-DN-e-cadherin); Gt(jup-citrine)ct520a animals demonstrating increased neutrophil recruitment to granulomas in DN-E-cadherin expressing animals. The extent of each granuloma is indicated by the dotted lines. Scale bar – 25 µm. (D) Quantitation of neutrophil numbers (normalized to area) in Tg(mfap4:icre; ubb:BSR); Gt(jup-citrine)ct520a and Tg(mfap4:icre; ubb:BS-DN-e-cadherin); Gt(jup-citrine)ct520a animals. Box indicates 25% and 75% percentile, and whiskers 10%-90% percentile. Outliers indicated as individual points. For control granulomas, n = 107; for DN-E-cadherin granulomas, n = 209. Results pooled over 6 animals in controls and 9 animals in DN-E-cadherin. (E) Mycobacteria (cyan), neutrophils (red, α-LysC) and plakoglobin (green, Gt(jup-citrine)ct520a) in Tg(mfap4:icre; ubb:BS-DN-e-cadherin); Gt(jup-citrine)ct520a animals demonstrating preferential recruitment of neutrophils to regions of the granuloma devoid of plakoglobin-positive adherens junctions. Dotted line denotes regions of plakoglobin-positive adherens junction formation. Scale bar – 25 µm. (F) Quantitation of area-normalized neutrophil counts in plakoglobin positive and plakoglobin negative regions of Tg(mfap4:icre; ubb:BS-DN-e-cadherin); Gt(jup-citrine)ct520a animals. Only granulomas in which distinct plakoglobin positive and negative regions could be identified were analyzed. Data from 17 granulomas from 3 independent animals. See also Figures S5 and S6.
Figure 7
Figure 7. E-cadherin Is Expressed in Granuloma Macrophages in Human Mtb Patients and Mouse Models
(A) Left – H&E staining of a human lymph node granuloma from a patient with disseminated Mtb infection. Right – Representative immunohistochemical image of E-cadherin (brown precipitate) in human Mtb lymph node sample showing junctional localization of E-cadherin within epithelioid macrophages. Nuclei are counterstained with hematoxylin. Yellow box indicates the area magnified in the bottom panels. Scale bar – 50 µm. (B) Representative double immunofluorescence of a human Mtb lymph node granuloma demonstrating expression of E-cadherin (green) within CD68 positive macrophages (red). Scale bar – 100 µm. (C) Top – H&E staining of a necrotic M. avium granuloma in the lung. Central necrotic region is visualized as eosinophilic focus devoid of hematoxylin positive nuclei marked with N. The extent of the necrotic core is outlined in the dotted lines. Bottom – Representative immunohistochemical staining of E-cadherin within an M. avium lung granuloma. Extensive E-cadherin staining is seen in the palisading macrophages immediately surrounding the necrotic core. Scale bar – 500 µm. (A–C) Images representative of 9 granulomas from 8 independent patients with mycobacterial granulomas, all of which were positive for E-cadherin staining. (D) Diffuse E-cadherin (brown precipitate) is seen throughout granuloma macrophages in 8 wpi H37Rv Mtb granulomas in C57BL/6 mouse lung. Nuclei are counterstained with hematoxylin. Scale bar – 50 µm. (E) E-cadherin (Brown) localizes to cell-cell junctions between granuloma macrophages in 135 dpi granulomas in CBA/J mice infected with Mtb Erdman. See also Figure S7.

Comment in

References

    1. Adams DO. The structure of mononuclear phagocytes differentiating in vivo. I. Sequential fine and histologic studies of the effect of Bacillus Calmette-Guerin (BCG) Am JPathol. 1974;76:17–48. - PMC - PubMed
    1. Adams DO. The granulomatous inflammatory response. A review. Am J Pathol. 1976;84:164–192. - PMC - PubMed
    1. Beamer GL, Flaherty DK, Assogba BD, Stromberg P, Gonzalez-Juarrero M, de Waal Malefyt R, Vesosky B, Turner J. lnterleukin-10 promotes Mycobacterium tuberculosis disease progression in CBA/J mice. J Immunol. 2008;181:5545–5550. - PMC - PubMed
    1. Bryant DM, Mostov KE. From cells to organs: building polarized tissue. Nat Rev Mol Cell Biol. 2008;9:887–901. - PMC - PubMed
    1. Chung K, Wallace J, Kim SY, Kalyanasundaram S, Andalman AS, Davidson TJ, Mirzabekov JJ, Zalocusky KA, Mattis J, Denisin AK, et al. Structural and molecular interrogation of intact biological systems. Nature. 2013;497:332–337. - PMC - PubMed

Publication types