

Membrane/Water Partition Coefficients of Bile Salts Determined Using Laurdan as a Fluorescent Probe
- PMID: 27760358
- PMCID: PMC5072983
- DOI: 10.1016/j.bpj.2016.08.040
Membrane/Water Partition Coefficients of Bile Salts Determined Using Laurdan as a Fluorescent Probe
Abstract
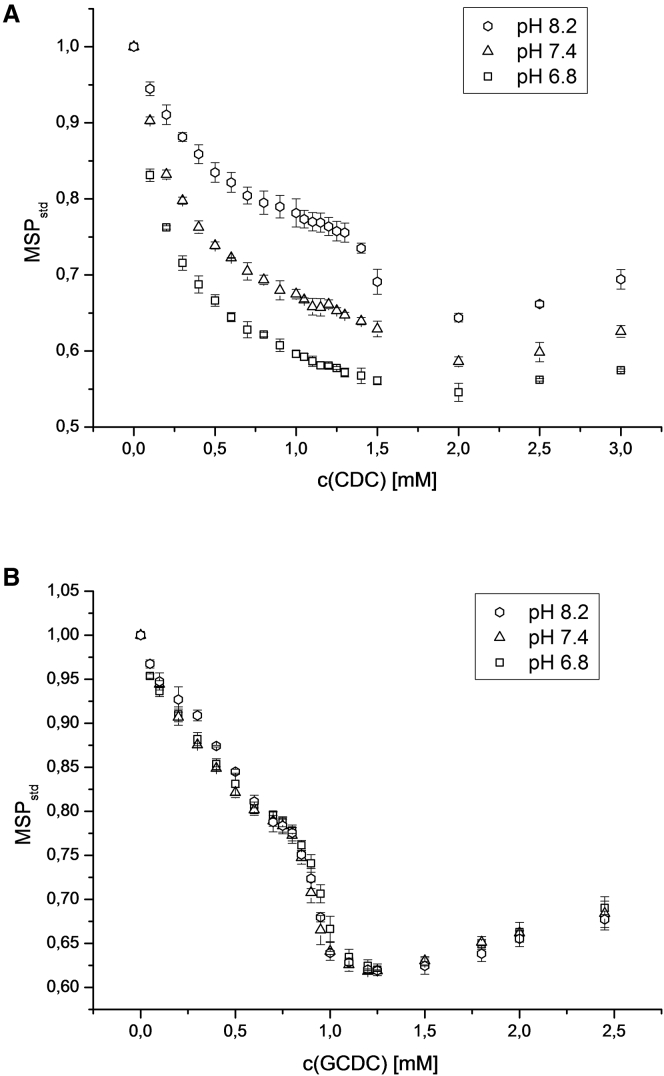
The interaction of liposomal membranes composed of soybean phosphatidylcholine with the bile salts (BSs) cholate (Ch), glycocholate (GC), chenodeoxycholate (CDC), and glycochenodeoxycholate (GCDC) was studied. The BSs differed with regard to their lipophilicity, pKa values, and the size of their hydrophilic moiety. Their membrane interactions were investigated using Laurdan as a membrane-anchored fluorescent dye. The apparent membrane/water partition coefficient, D, at pH 7.4 was calculated from binding plots and compared with direct binding measurements using ultracentrifugation as a reference. The Laurdan-derived LogD values at pH 7.4 were found to be 2.10 and 2.25 for the trihydroxy BSs, i.e., Ch and GC, and 2.85 and 2.75 for the dihydroxy BSs, i.e., CDC and GCDC, respectively. For the membrane-associated glycine-conjugated GC and GCDC (pKa values of ∼3.9), no differences in the Laurdan spectra of the respective BS were found at pH 6.8, 7.4, and 8.2. Unconjugated Ch and CDC (pKa values of ∼5.0) showed pronounced differences at the three pH values. Furthermore, the kinetics of membrane adsorption and transbilayer movement differed between conjugated and unconjugated BSs as determined with Laurdan-labeled liposomes.
Copyright © 2016. Published by Elsevier Inc.
Figures


Similar articles
-
LAURDAN since Weber: The Quest for Visualizing Membrane Heterogeneity.Acc Chem Res. 2021 Feb 16;54(4):976-987. doi: 10.1021/acs.accounts.0c00687. Epub 2021 Jan 29. Acc Chem Res. 2021. PMID: 33513300 Free PMC article.
-
Quantitative Monitoring of Microphase Separation Behaviors in Cationic Liposomes Using HHC, DPH, and Laurdan: Estimation of the Local Electrostatic Potentials in Microdomains.Langmuir. 2016 Apr 19;32(15):3630-6. doi: 10.1021/acs.langmuir.5b04682. Epub 2016 Apr 6. Langmuir. 2016. PMID: 27022833
-
Relationships between membrane water molecules and Patman equilibration kinetics at temperatures far above the phosphatidylcholine melting point.Biochim Biophys Acta. 2015 Apr;1848(4):942-50. doi: 10.1016/j.bbamem.2014.12.021. Epub 2015 Jan 2. Biochim Biophys Acta. 2015. PMID: 25559316
-
Disorder Amidst Membrane Order: Standardizing Laurdan Generalized Polarization and Membrane Fluidity Terms.J Fluoresc. 2017 Jan;27(1):243-249. doi: 10.1007/s10895-016-1951-8. Epub 2016 Oct 13. J Fluoresc. 2017. PMID: 27738919 Review.
-
Laurdan in living cells: Where do we stand?Chem Phys Lipids. 2025 Jan;266:105458. doi: 10.1016/j.chemphyslip.2024.105458. Epub 2024 Nov 26. Chem Phys Lipids. 2025. PMID: 39603319 Review.
Cited by
-
Bile Acids as a New Type of Steroid Hormones Regulating Nonspecific Energy Expenditure of the Body (Review).Sovrem Tekhnologii Med. 2021;12(5):114-127. doi: 10.17691/stm2020.12.5.13. Epub 2020 Oct 28. Sovrem Tekhnologii Med. 2021. PMID: 34796012 Free PMC article. Review.
-
Bile Acids as Inducers of Protonophore and Ionophore Permeability of Biological and Artificial Membranes.Membranes (Basel). 2023 Apr 28;13(5):472. doi: 10.3390/membranes13050472. Membranes (Basel). 2023. PMID: 37233533 Free PMC article. Review.
-
CAPRYDAA, an anthracene dye analog to LAURDAN: a comparative study using cuvette and microscopy.J Mater Chem B. 2020 Jan 7;8(1):88-99. doi: 10.1039/c9tb01738k. Epub 2019 Nov 26. J Mater Chem B. 2020. PMID: 31769463 Free PMC article.
References
-
- Pauletti G.M., Wunderli-Allenspach H. Partition coefficients in vitro: artificial membranes as a standardized distribution model. Eur. J. Pharm. Sci. 1994;1:273–282.
-
- Schubert R. Comparison of octanol/buffer and liposome/buffer partition coefficients as model for the in vivo behaviour of drugs. Proc. MoBBEL. 1994;8:20–32.
-
- Leo A., Hansch C., Elkins D. Partition coefficients and their uses. Chem. Rev. 1971;71:525–616.
-
- van Balen G.P., Martinet Ca., Testa B. Liposome/water lipophilicity: methods, information content, and pharmaceutical applications. Med. Res. Rev. 2004;24:299–324. - PubMed
-
- Chong P.L.G., Sugár I.P. Fluorescence studies of lipid regular distribution in membranes. Chem. Phys. Lipids. 2002;116:153–175. - PubMed
MeSH terms
Substances
LinkOut - more resources
Full Text Sources
Other Literature Sources
Miscellaneous
