

Charge Distribution Fine-Tunes the Translocation of α-Helical Amphipathic Peptides across Membranes
- PMID: 27760360
- PMCID: PMC5071627
- DOI: 10.1016/j.bpj.2016.08.047
Charge Distribution Fine-Tunes the Translocation of α-Helical Amphipathic Peptides across Membranes
Abstract
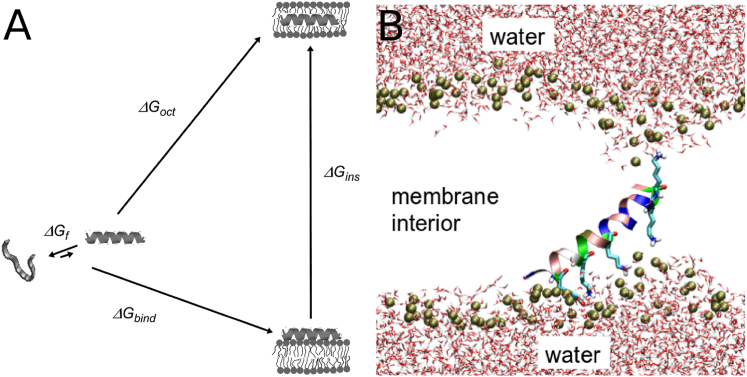
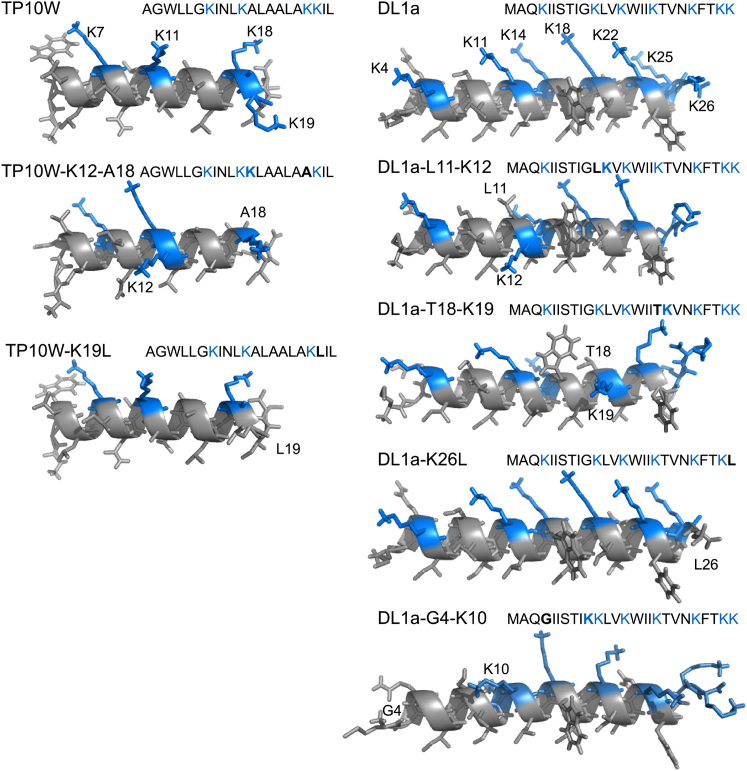
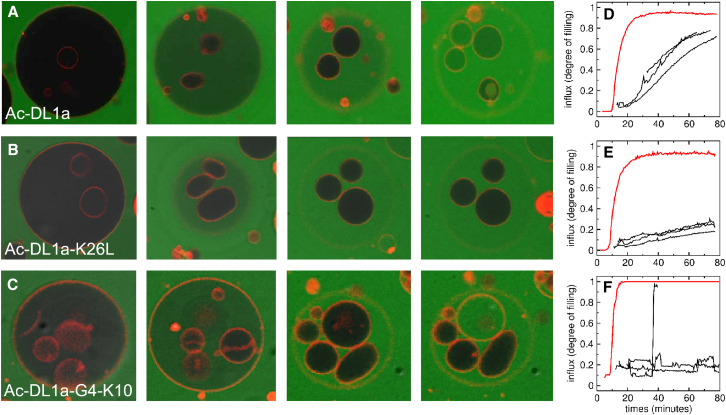
Hundreds of cationic antimicrobial and cell-penetrating peptides (CPPs) form amphipathic α-helices when bound to lipid membranes. Here, we test two hypotheses for the differences in the ability of these peptides to translocate across membranes. The first, which we now call the hydrophobicity hypothesis, is that peptide translocation is determined by the Gibbs energy of insertion into the bilayer from the membrane interface. The second, which we call the charge-distribution hypothesis, is that translocation is determined by whether the distribution of cationic residues in the peptide can transiently stabilize a high-energy inserted intermediate by forming salt bridges to the phosphates of lipid headgroups. To test these hypotheses, we measured translocation of two series of peptide variants. The first series was based on TP10W, a peptide derived from the amphipathic CPP transportan 10; the second was based on DL1a, a synthetic peptide derived from staphylococcal δ-lysin. The peptides in those two series had small sequence changes relative to TP10W and DL1a: either single-residue substitutions or two-residue switches, which were designed to increase or decrease translocation differently according to the two hypotheses. We found that with regard to the changes introduced in the sequences, five out of six peptide variants translocated in agreement with the charge-distribution hypothesis, whereas none showed agreement with the hydrophobicity hypothesis. We conclude that large effects on translocation are probably determined by hydrophobicity, but the fine tuning appears to arise from the distribution of cationic residues along the peptide sequence.
Copyright © 2016 Biophysical Society. Published by Elsevier Inc. All rights reserved.
Figures
Similar articles
-
A thermodynamic approach to the mechanism of cell-penetrating peptides in model membranes.Biochemistry. 2011 Feb 8;50(5):654-62. doi: 10.1021/bi1013358. Epub 2011 Jan 11. Biochemistry. 2011. PMID: 21166473 Free PMC article.
-
Membrane-active peptides: binding, translocation, and flux in lipid vesicles.Biochim Biophys Acta. 2014 Sep;1838(9):2216-27. doi: 10.1016/j.bbamem.2014.04.014. Epub 2014 Apr 25. Biochim Biophys Acta. 2014. PMID: 24769436 Free PMC article. Review.
-
Interactions of amphipathic CPPs with model membranes.Methods Mol Biol. 2011;683:41-56. doi: 10.1007/978-1-60761-919-2_4. Methods Mol Biol. 2011. PMID: 21053121
-
A molecular dynamics study of cell-penetrating peptide transportan-10 (TP10): Binding, folding and insertion to transmembrane state in zwitterionic membrane.Biochim Biophys Acta Biomembr. 2024 Jan;1866(1):184218. doi: 10.1016/j.bbamem.2023.184218. Epub 2023 Aug 25. Biochim Biophys Acta Biomembr. 2024. PMID: 37634858 Free PMC article.
-
When cationic cell-penetrating peptides meet hydrocarbons to enhance in-cell cargo delivery.J Pept Sci. 2015 May;21(5):356-69. doi: 10.1002/psc.2755. Epub 2015 Mar 18. J Pept Sci. 2015. PMID: 25787823 Review.
Cited by
-
Physicochemical Features and Peculiarities of Interaction of AMP with the Membrane.Pharmaceuticals (Basel). 2021 May 17;14(5):471. doi: 10.3390/ph14050471. Pharmaceuticals (Basel). 2021. PMID: 34067510 Free PMC article. Review.
-
Tuning of a Membrane-Perforating Antimicrobial Peptide to Selectively Target Membranes of Different Lipid Composition.J Membr Biol. 2021 Feb;254(1):75-96. doi: 10.1007/s00232-021-00174-1. Epub 2021 Feb 10. J Membr Biol. 2021. PMID: 33564914
-
Cell-Penetrating Peptides and Transportan.Pharmaceutics. 2021 Jun 29;13(7):987. doi: 10.3390/pharmaceutics13070987. Pharmaceutics. 2021. PMID: 34210007 Free PMC article. Review.
-
Hybrid Cyclobutane/Proline-Containing Peptidomimetics: The Conformational Constraint Influences Their Cell-Penetration Ability.Int J Mol Sci. 2021 May 11;22(10):5092. doi: 10.3390/ijms22105092. Int J Mol Sci. 2021. PMID: 34065025 Free PMC article.
-
Daptomycin-Phosphatidylglycerol Domains in Lipid Membranes.Langmuir. 2017 Nov 28;33(47):13669-13679. doi: 10.1021/acs.langmuir.7b01841. Epub 2017 Nov 13. Langmuir. 2017. PMID: 29130685 Free PMC article.
References
-
- Green M., Loewenstein P.M. Autonomous functional domains of chemically synthesized human immunodeficiency virus tat trans-activator protein. Cell. 1988;55:1179–1188. - PubMed
-
- Frankel A.D., Pabo C.O. Cellular uptake of the tat protein from human immunodeficiency virus. Cell. 1988;55:1189–1193. - PubMed
-
- Derossi D., Joliot A.H., Prochiantz A. The third helix of the Antennapedia homeodomain translocates through biological membranes. J. Biol. Chem. 1994;269:10444–10450. - PubMed
-
- Derossi D., Calvet S., Prochiantz A. Cell internalization of the third helix of the Antennapedia homeodomain is receptor-independent. J. Biol. Chem. 1996;271:18188–18193. - PubMed
-
- Langel U. Springer; New York: 2011. Cell-Penetrating Peptides.
MeSH terms
Substances
Grants and funding
LinkOut - more resources
Full Text Sources
Other Literature Sources
Miscellaneous
