. 2017 Jan 1;117(1):163-177.
doi: 10.1152/jn.00415.2016. Epub 2016 Oct 19.

Thalamic state control of cortical paired-pulse dynamics

Affiliations

Thalamic state control of cortical paired-pulse dynamics

Clarissa J Whitmire et al. J Neurophysiol. .

Abstract

Sensory stimulation drives complex interactions across neural circuits as information is encoded and then transmitted from one brain region to the next. In the highly interconnected thalamocortical circuit, these complex interactions elicit repeatable neural dynamics in response to temporal patterns of stimuli that provide insight into the circuit properties that generated them. Here, using a combination of in vivo voltage-sensitive dye (VSD) imaging of cortex, single-unit recording in thalamus, and optogenetics to manipulate thalamic state in the rodent vibrissa pathway, we probed the thalamocortical circuit with simple temporal patterns of stimuli delivered either to the whiskers on the face (sensory stimulation) or to the thalamus directly via electrical or optogenetic inputs (artificial stimulation). VSD imaging of cortex in response to whisker stimulation revealed classical suppressive dynamics, while artificial stimulation of thalamus produced an additional facilitation dynamic in cortex not observed with sensory stimulation. Thalamic neurons showed enhanced bursting activity in response to artificial stimulation, suggesting that bursting dynamics may underlie the facilitation mechanism we observed in cortex. To test this experimentally, we directly depolarized the thalamus, using optogenetic modulation of the firing activity to shift from a burst to a tonic mode. In the optogenetically depolarized thalamic state, the cortical facilitation dynamic was completely abolished. Together, the results obtained here from simple probes suggest that thalamic state, and ultimately thalamic bursting, may play a key role in shaping more complex stimulus-evoked dynamics in the thalamocortical pathway.

New & noteworthy: For the first time, we have been able to utilize optogenetic modulation of thalamic firing modes combined with optical imaging of cortex in the rat vibrissa system to directly test the role of thalamic state in shaping cortical response properties.

Keywords: cortical activation; dynamics; optogenetics; thalamic state; vibrissa.


Figures

Fig. 1.
Fig. 1.
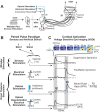
Quantification of thalamocortical dynamics using natural and artificial paired-pulse paradigm. A: schematic of the feedforward lemniscal circuit of the rat whisker pathway from the whisker pad to the brain stem principal nucleus (PrV) of the trigeminal complex, the ventral posteromedial (VPm) nucleus of the thalamus, and ultimately primary somatosensory cortex (S1). The optrode was positioned in the VPm for optical and electrical stimulation. VSDI, voltage-sensitive dye imaging. B: the paired-pulse paradigm consists of 2 temporally spaced stimuli administered at the whisker (sensory stimulus) or directly to the thalamus (electrical and optical stimulation). C: VSDI of the barrel cortex recorded the cortical activation (top). The activity within a barrel/region of interest is averaged together to quantify the temporal response to a stimulus (black traces). Trial-averaged examples of the cortical response are depicted in response to pairs of whisker (1,200°/s), electrical (40 μA), optical (90 mW/mm2), and electrical in the presence of optical depolarization (60 μA) stimuli.
Fig. 2.
Fig. 2.
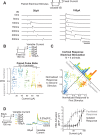
Sensory-evoked cortical dynamics elicit suppressive paired-pulse dynamics. A, left: cortical response to pairs of weak (150°/s) whisker stimuli. The response to the second stimulus was suppressed only for the 50-ms interstimulus interval (ISI). Right: cortical response to pairs of high-velocity (1,200°/s) whisker deflections at varying ISI. The response to the second stimulus was suppressed relative to the first, with the suppression relaxing for longer ISIs. B, top: with the ISI fixed at 150 ms, the velocity of the stimuli was varied systematically. Bottom: the paired-pulse ratio (PPR) is plotted as a function of stimulus intensity, represented by color. Each trial across experiments (n = 4 animals, each denoted by a vertical line of points) is plotted as a dot, with the median of the distribution indicated by the horizontal black bars (animal median shown as well as population median). For each condition, asterisk indicates statistical significance relative to first stimulus condition (2-way ANOVA; factors: animal, stimulus condition; P < 0.05). P values for each stimulus condition [150, 300, 600, 1,200°/s] relative to the first stimulus condition (75°/s) are P = [0.8727, 0.2698, 3.73e-4, 3.99e-5]. C: the normalized response to the first and second stimuli are plotted for all single trials across all whisker deflection velocities at the 150-ms ISI for all experiments (n = 4 animals). Along the diagonal, a histogram represents the distance of each trial from the unity line (black). Data below the unity line are indicative of suppressive dynamics, while data above the unity line are indicative of facilitation dynamics.
Fig. 3.
Fig. 3.
Artificially evoked cortical responses elicit different paired-pulse dynamics. A, left: cortical response to pairs of weak (50 μA) electrical stimuli. The response to the second stimulus was facilitated relative to the first, but only for the 100- to 200-ms interstimulus intervals (ISIs). Right: cortical response to pairs of strong (100 μA) electrical stimuli at varying ISI was purely suppressive. The response to the second stimulus was suppressed relative to the first, with the suppression relaxing for longer ISIs. B, top: with the ISI fixed at 150 ms, the amplitude of the current was varied systematically. Bottom: the paired-pulse ratio (PPR) is plotted as a function of stimulus intensity, represented by color. Each trial across experiments (n = 4 animals, each denoted by a vertical line of points) is plotted as a dot, with the median of the distribution indicated by the horizontal black bars (animal median shown as well as population median). For each condition, asterisk indicates statistical significance relative to first stimulus condition (2-way ANOVA; factors: animal, stimulus condition; P < 0.05). P values for each stimulus condition [40, 60, 80, 100 μA] relative to the first stimulus condition (20 μA) are P = [9.92e-9, 0.9992, 1.08e-7, 9.92e-9]. C: normalized responses to the first and second stimuli are plotted for all single trials across all current amplitudes at the 150-ms ISI for all experiments (n = 4 animals). Along the diagonal, a histogram represents the distance of each trial from the unity line (black). Data below the unity line are indicative of suppressive dynamics, while data above the unity line are indicative of facilitation dynamics. Note the significant number of trials classified as facilitative. D, left: in a separate experiment (n = 1 animal), the first stimulus was held fixed at a facilitating current amplitude (60 μA) while the second stimulus was allowed to vary in amplitude. Right: the evoked response to the second variable amplitude stimulus (facilitated response) was greater than the response to the same current amplitude presented in isolation (isolated response). Values shown are means ± SE (10 trials per condition).
Fig. 4.
Fig. 4.
Temporal dynamics of the decay of cortical activation following stimulation can last hundreds of milliseconds. A: the decay from the peak response was well approximated by the sum of 2 exponentials (equation, top). In this example (τ1 = 10.2 ms, τ2 = 337.7 ms), the data points used to fit the curve are shown in red while the ongoing response is shown in gray (left; full curve fit shown as solid red line, individual exponentials plotted as dotted lines). B: across experiments, τ1 was defined as the shorter time constant. Median τ1 values are [20.3, 16.2, 10.5, 13.1, 9.3] ms for increasing whisker stimulus amplitudes and [14.0, 20.4, 10.1, 9.5, 10.0] ms for increasing current stimulus amplitudes. C: across experiments, τ2 was defined as the longer time constant. Median τ2 values are [64.5, 44.6, 85.2, 74.6, 110.3] ms for increasing whisker stimulus amplitudes and [55.3, 29.4, 162.8, 177.6, 323.2] ms for increasing current stimulus amplitudes.
Fig. 5.
Fig. 5.
Optogenetic stimulation of the thalamus also exhibits bimodal nonlinear dynamics. A: example histological image of opsin spread within thalamus. VPm, ventral posteromedial thalamus; Po, posterior thalamus, nRT, reticular nucleus of the thalamus; S1BC, barrel cortex. B: example of the cortical response, averaged within a single cortical column, to increasing stimulus intensities (ISI = 150 ms). C: the response to the second stimulus is plotted against the response to the first stimulus for single trials of varying light intensity. Points above the unity line (diagonal) were facilitated, while points below the unity line were suppressed (n = 5 animals). The responses were normalized, for each animal, relative to the mean response for the strongest light intensity during that experiment. Optogenetic stimulation exhibited a mixture of facilitation and suppression, with the facilitation less reliable on a trial-to-trial basis. D: rastergram and peristimulus time histogram for an example single-unit VPm cell in response to paired optogenetic stimuli of increasing intensity. Within the rastergram, red spikes belong to an identified burst. E: across neurons (N = 11 neurons), the overall evoked response, defined as the average number of spikes elicited within 20 ms of stimulus onset, was not different for the first and second stimuli (left; n.s., P = 0.47, 3-way ANOVA; factors: animal, stimulus condition, stimulus number), but the burst activity was higher in response to the second stimulus (center; P = 2.79e-4, 3-way ANOVA; factors: animal, stimulus condition, stimulus number). The first spike latency (FSL) was also higher in response to the second pulse compared with the first (right; P = 0.001, 3-way ANOVA; factors: animal, stimulus condition, stimulus number). Note that 8 of 11 neurons were collected with a different anesthesia. These data points are indicated by open circles, while neurons collected with the same anesthesia as the imaging experiments are indicated by filled circles.
Fig. 6.
Fig. 6.
Depolarization of the thalamus eliminates thalamic bursting and cortical paired-pulse facilitation. A: under anesthesia, thalamic neurons spontaneously burst, firing multiple action potentials in quick succession (left). Right: for each spike, the interspike interval (ISI) to the previous spike is plotted against the ISI to the next spike. The red boxes outline spikes that could make up a burst. In the anesthetized state, the proportion of spikes that make up bursts (BP) is 52%. FR, firing rate. B: when depolarized through optogenetic manipulation the thalamic neurons switch to a tonic firing mode (left), and the majority of spikes occur in tonic firing and very few (3%) during bursts (right). C: example of the mean cortical response, as measured through VSDI, to pairs of thalamic microstimuli with increasing strength (interstimulus interval is 150 ms). As described above, facilitation occurs at subthreshold currents whereas suppression characterizes suprathreshold currents in the control state (center), and this is consistent across animals (right; n = 3 animals). D: when the thalamus is depolarized, there is no longer facilitation in the evoked cortical response (left). In an example recording with thalamic depolarization, the cortical response undergoes paired-pulse suppression for all current intensities (center), and this is consistent across animals (right; n = 3 animals). Data are normalized with respect to the maximum response amplitude within that experiment.

References

    1. Aravanis AM, Wang LP, Zhang F, Meltzer LA, Mogri MZ, Schneider MB, Deisseroth K. An optical neural interface: in vivo control of rodent motor cortex with integrated fiberoptic and optogenetic technology. J Neural Eng 4: S143–S156, 2007. - PubMed
    1. Bale MR, Campagner D, Erskine A, Petersen RS. Microsecond-scale timing precision in rodent trigeminal primary afferents. J Neurosci 35: 5935–5940, 2015. - PMC - PubMed
    1. Berg RW, Kleinfeld D. Rhythmic whisking by rat: retraction as well as protraction of the vibrissae is under active muscular control. J Neurophysiol 89: 104–117, 2003. - PubMed
    1. Boloori AR, Jenks RA, Desbordes G, Stanley GB. Encoding and decoding cortical representations of tactile features in the vibrissa system. J Neurosci 30: 9990–10005, 2010. - PMC - PubMed
    1. Boloori AR, Stanley GB. The dynamics of spatiotemporal response integration in the somatosensory cortex of the vibrissa system. J Neurosci 26: 3767–3782, 2006. - PMC - PubMed

Publication types

MeSH terms

LinkOut - more resources