. 2016 Oct 5:4:76.
doi: 10.3389/fbioe.2016.00076. eCollection 2016.

13C Metabolic Flux Analysis for Systematic Metabolic Engineering of S. cerevisiae for Overproduction of Fatty Acids

Affiliations

13C Metabolic Flux Analysis for Systematic Metabolic Engineering of S. cerevisiae for Overproduction of Fatty Acids

Amit Ghosh et al. Front Bioeng Biotechnol. .

Abstract

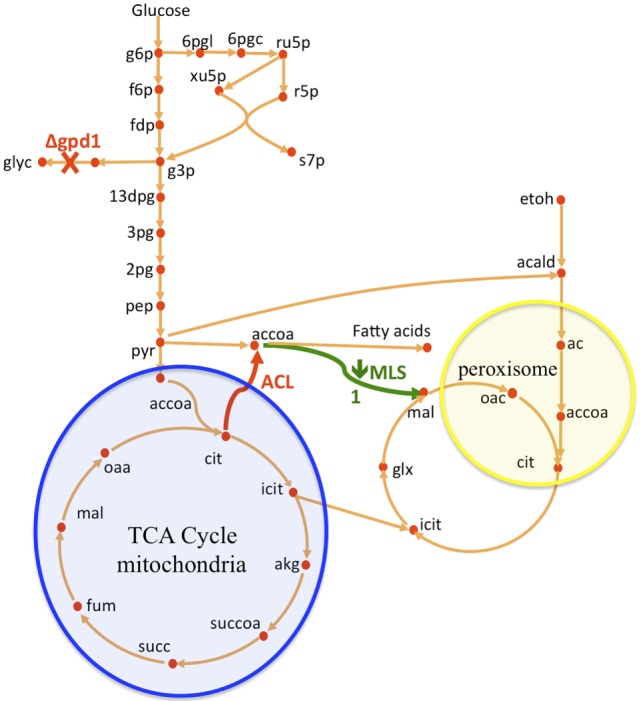
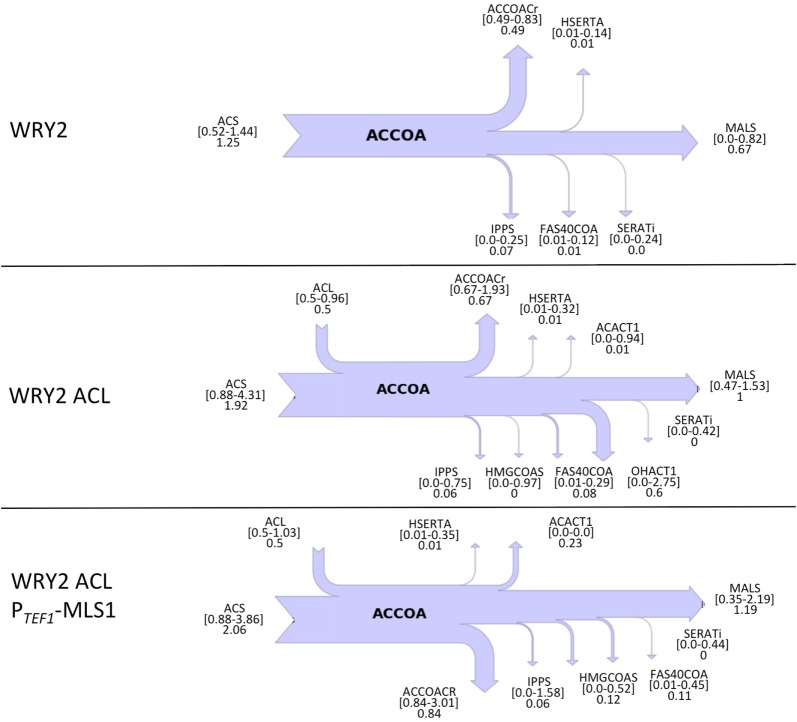
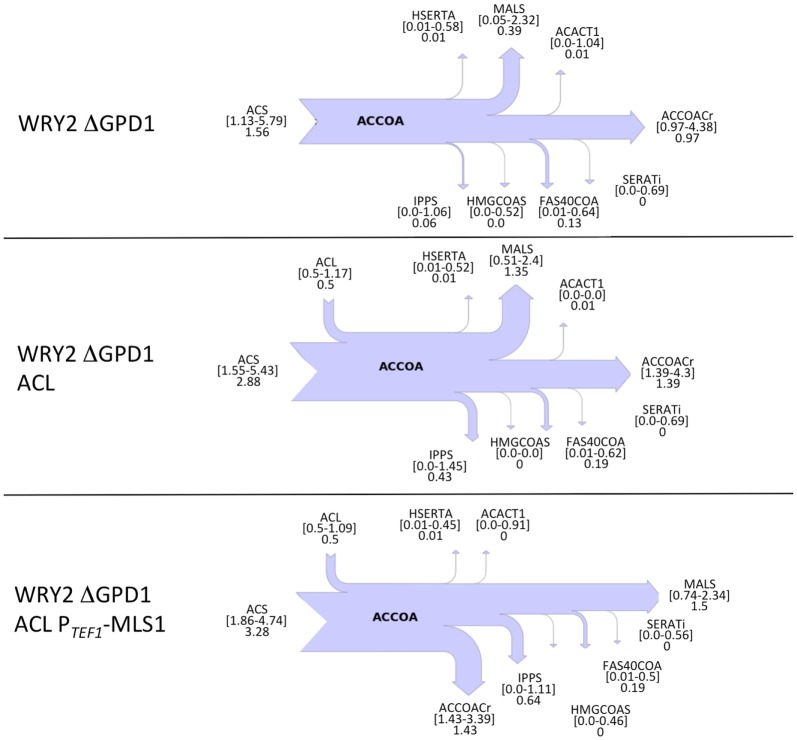
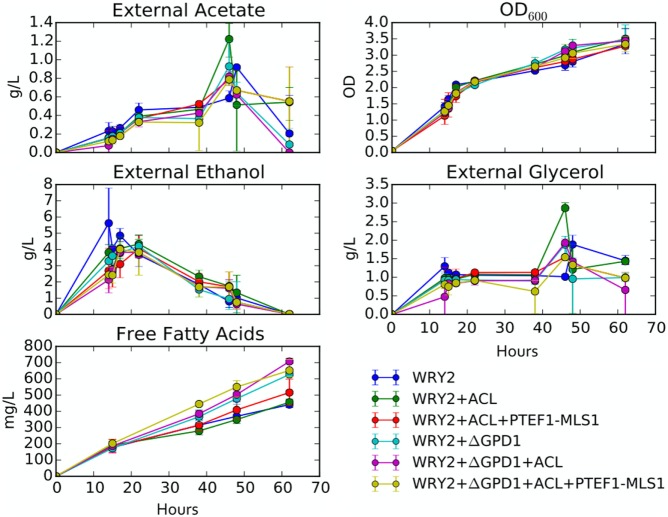
Efficient redirection of microbial metabolism into the abundant production of desired bioproducts remains non-trivial. Here, we used flux-based modeling approaches to improve yields of fatty acids in Saccharomyces cerevisiae. We combined 13C labeling data with comprehensive genome-scale models to shed light onto microbial metabolism and improve metabolic engineering efforts. We concentrated on studying the balance of acetyl-CoA, a precursor metabolite for the biosynthesis of fatty acids. A genome-wide acetyl-CoA balance study showed ATP citrate lyase from Yarrowia lipolytica as a robust source of cytoplasmic acetyl-CoA and malate synthase as a desirable target for downregulation in terms of acetyl-CoA consumption. These genetic modifications were applied to S. cerevisiae WRY2, a strain that is capable of producing 460 mg/L of free fatty acids. With the addition of ATP citrate lyase and downregulation of malate synthase, the engineered strain produced 26% more free fatty acids. Further increases in free fatty acid production of 33% were obtained by knocking out the cytoplasmic glycerol-3-phosphate dehydrogenase, which flux analysis had shown was competing for carbon flux upstream with the carbon flux through the acetyl-CoA production pathway in the cytoplasm. In total, the genetic interventions applied in this work increased fatty acid production by ~70%.

Keywords: -omics data; 13C metabolic flux analysis; flux analysis; metabolic engineering; predictive biology.


Figures

Figure 1
Figure 1
Overview of S. cerevisiae metabolic pathways relevant to this study and metabolic interventions. A non-native ATP citrate lyase (ACL) was introduced with the intention of increasing acetyl-CoA (accoa) supply, but fatty acid production did not increase significantly (Figure 2). The use of flux analysis suggested that more acetyl-coA was indeed produced, but that it was lost through malate synthesis (MLS, Figure 3). Downregulating this enzyme increased fatty acid (FA) production 26% (Figure 2). The use again of flux analysis suggested knocking out glycerol production (GPD1) for increased production. FA production improved an extra 33% (Figure 2). The mitochondrial and peroxisomal compartments are represented as blue and yellow circles, respectively. Metabolite abbreviations follow the BIGG database (Schellenberger et al., 2010).
Figure 2
Figure 2
Fatty acid production for the various strains studied in this manuscript. S. cerevisiae WRY2 is the base strain used for these studies. The addition of ACL was expected to increase acetyl-CoA availability but did not increase final production. However, the downregulation of MLS did increase production, as suggested by flux analysis. The highest production was obtained by knocking out glycerol production, improving production in the overall engineering process by 70%. Fatty acid measurements shown here were performed at the end of 100 h, and the error bars represent the SD obtained for three replicates.
Figure 3
Figure 3
Cytosolic acetyl-CoA balances obtained from 2S-13C MFA for WRY2, WRY2 ACL, and WRY2 ACL PTEF1-MLS1. Flux of acetyl-CoA (accoa) producing and consuming reactions is shown as a sankey diagram. Reactions on the left of the diagram produce acetyl-coA and reactions on the right consume it, with arrow size indicating total flux. Reaction and metabolite names follow the BIGG database conventions (Schellenberger et al., 2010). Numbers below the reaction names indicate best fits to data and confidence intervals. For example, the acetyl-coA synthetase (ACS) for WRY2 shows that the flux that best fits the data is 1.25, but the flux could be any value between 0.52 and 1.44 (confidence intervals). The top diagram (WRY2) shows that all acetyl-coA is produced by ACS and MALS may act as a sink, although this is not assured (lower confidence interval is 0). Once the ACL is added (WRY2 ACL), total acetyl-coA increases, but the carbon sink into MALS becomes certain (lower confidence interval 0.47 >0), which is consistent with the lack of fatty acid production increase (Figure 2). Downregulation of MALS (WRY2 ACL PTEF1-MLS1) seems to have produced an increase in flux toward fatty acid metabolism, for which the reaction ACCOACr is the first step. The confidence intervals for ACCOACr before and after the downregulation ([0.67–1.93] vs. [0.84–3.01]) are too wide to make this conclusion, but the increase in fatty acid production (Figure 2) indicates this to be the case.
Figure 4
Figure 4
Cytosolic acetyl-CoA balances obtained from 2S-13C MFA for strains with GPD1 knocked out. Flux of acetyl-CoA (accoa) producing and consuming reactions is shown as a sankey diagram as in Figure 3. In spite of the large confidence intervals for the calculated fluxes, several conclusions can be drawn. The total flux through ACCOACr, for example, is doubled through the full engineering process presented here: compare [0.49–0.83] for WRY2 in Figure 3 versus [1.43–3.39] for WRY2 ΔGPD1 ACL PTEF1-MLS1 in this figure. Also, the effect of the GPD1 knockout definitely increases flux through ACCOACr ([0.49–0.83] for WRY2 in Figure 3 versus [0.97–4.38] for WRY2 ΔGPD1). Furthermore, the effect of ACL involves the definite activation of reaction MALS as a carbon sink (similar effect as in Figure 3).
Figure 5
Figure 5
Growth rates and external metabolite concentrations: shown are the external metabolite concentrations for ethanol, glycerol, and acetate for the strains studied in this manuscript. Biomass for these strains is displayed in terms of optical density at 600 nm (OD600). All measurements are an average over three biological replicates.

References

    1. Asadollahi M. A., Maury J., Patil K. R., Schalk M., Clark A., Nielsen J. (2009). Enhancing sesquiterpene production in Saccharomyces cerevisiae through in silico driven metabolic engineering. Metab. Eng. 11, 328–334.10.1016/j.ymben.2009.07.001 - DOI - PubMed
    1. Bokinsky G., Baidoo E. E. K., Akella S., Burd H., Weaver D., Alonso-Gutierrez J., et al. (2013). HipA-triggered growth arrest and β-lactam tolerance in Escherichia coli are mediated by RelA-dependent ppGpp synthesis. J. Bacteriol. 195, 3173–3182.10.1128/jb.02210-12 - DOI - PMC - PubMed
    1. Brachmann C. B., Davies A., Cost G. J., Caputo E., Li J., Hieter P., et al. (1998). Designer deletion strains derived from Saccharomyces cerevisiae S288C: a useful set of strains and plasmids for PCR-mediated gene disruption and other applications. Yeast 14, 115–132.10.1002/(sici)1097-0061(19980130)14:2<115:aid-yea204>3.0.co;2-2 - DOI - PubMed
    1. Chen J., Densmore D., Ham T. S., Keasling J. D., Hillson N. J. (2012). DeviceEditor visual biological CAD canvas. J. Biol. Eng. 6, 1.10.1186/preaccept-1967068768635731 - DOI - PMC - PubMed
    1. Chen Y., Daviet L., Schalk M., Siewers V., Nielsen J. (2013). Establishing a platform cell factory through engineering of yeast acetyl-CoA metabolism. Metab. Eng. 15, 48–54.10.1016/j.ymben.2012.11.002 - DOI - PubMed