. 2016:2016:4847812.
doi: 10.1155/2016/4847812. Epub 2016 Sep 28.

Metformin Inhibits Advanced Glycation End Products-Induced Inflammatory Response in Murine Macrophages Partly through AMPK Activation and RAGE/NF κ B Pathway Suppression

Affiliations

Metformin Inhibits Advanced Glycation End Products-Induced Inflammatory Response in Murine Macrophages Partly through AMPK Activation and RAGE/NF κ B Pathway Suppression

Zhong'e Zhou et al. J Diabetes Res. 2016.

Abstract

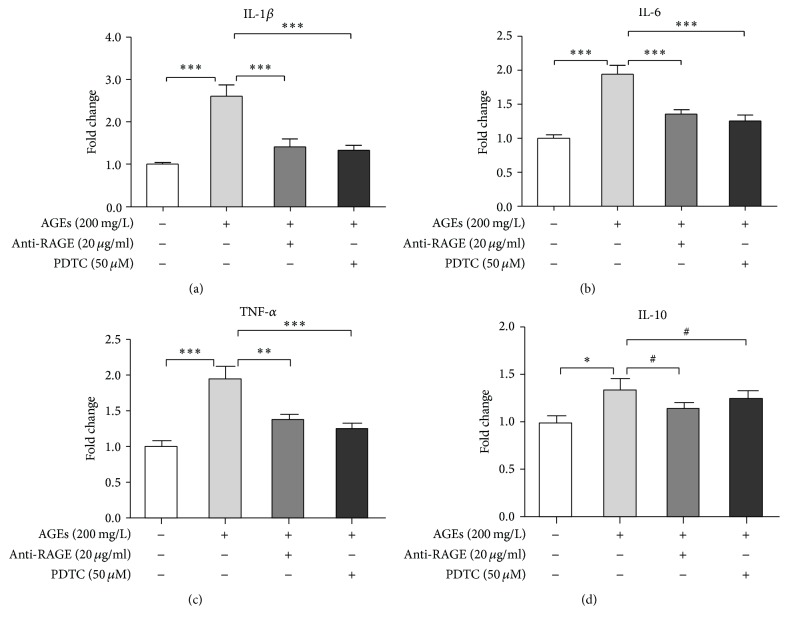
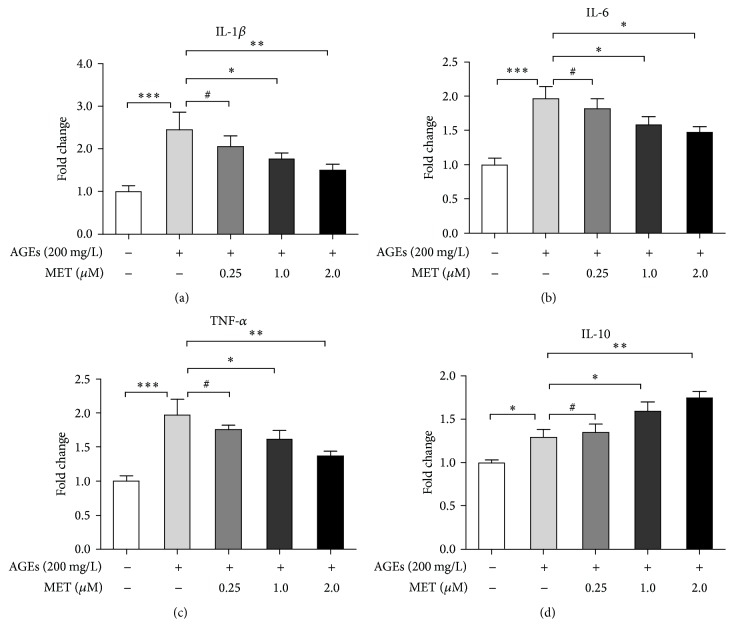
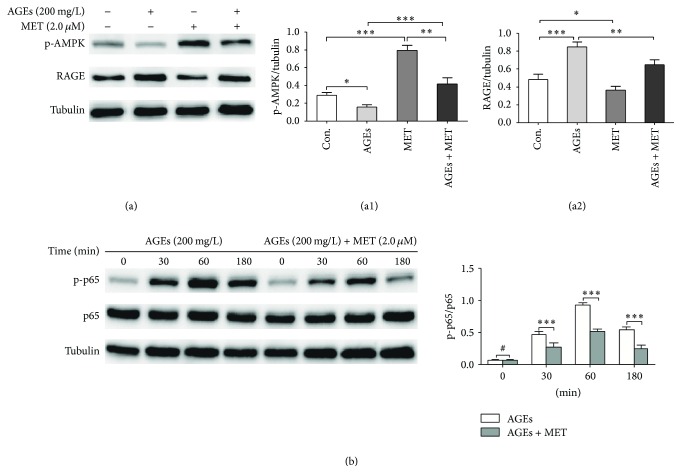
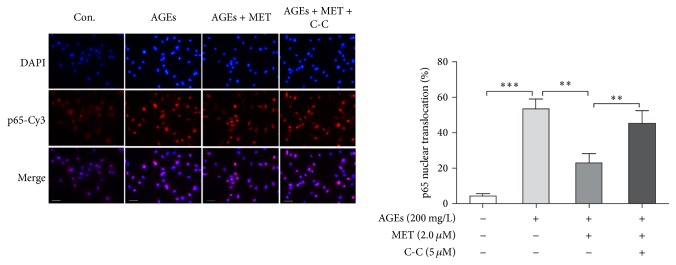
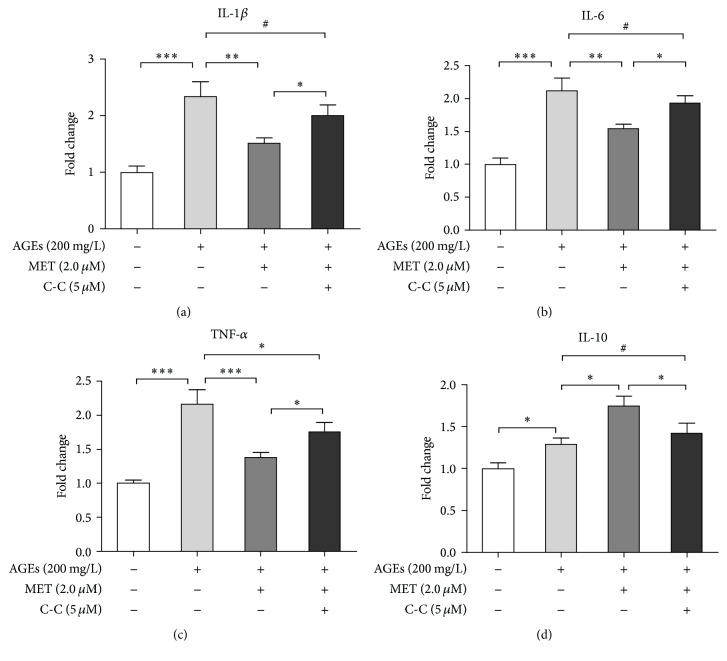
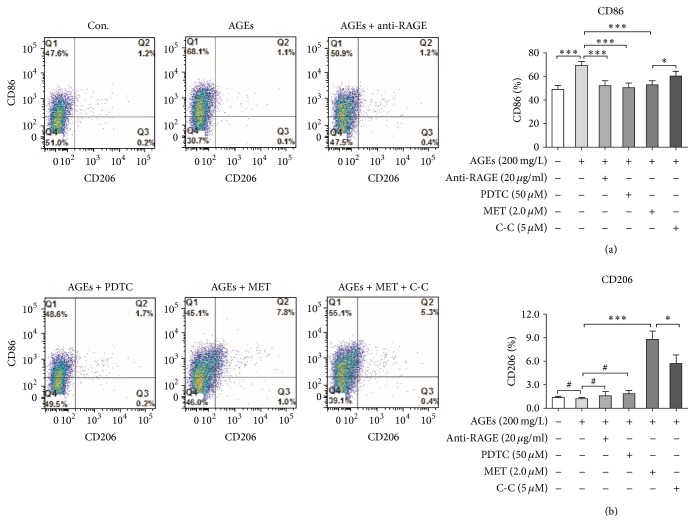
Advanced glycation end products (AGEs) are major inflammatory mediators in diabetes, affecting atherosclerosis progression via macrophages. Metformin slows diabetic atherosclerosis progression through mechanisms that remain to be fully elucidated. The present study of murine bone marrow derived macrophages showed that (1) AGEs enhanced proinflammatory cytokines (interleukin-1β (IL-1β), IL-6, and tumor necrosis factor-α (TNF-α)) mRNA expression, RAGE expression, and NFκB activation; (2) metformin pretreatment inhibited AGEs effects and AGEs-induced cluster designation 86 (CD86) (M1 marker) expression, while promoting CD206 (M2 marker) surface expression and anti-inflammatory cytokine (IL-10) mRNA expression; and (3) the AMPK inhibitor, Compound C, attenuated metformin effects. In conclusion, metformin inhibits AGEs-induced inflammatory response in murine macrophages partly through AMPK activation and RAGE/NFκB pathway suppression.


Figures

Figure 1
Figure 1
AGEs-induced inflammatory response in BMDMs through RAGE/NFκB signaling. BMDMs were divided into 4 groups: control, AGEs, AGEs + anti-RAGE, and AGEs + PDTC group. Cells in the last two groups were pretreated with anti-RAGE antibody (20 μg/mL) or PDTC (50 μM) for 60 min, respectively, and then, together with AGEs group, the three groups were cultured with AGEs (200 mg/L) for 24 h. The control group was treated with BSA (200 mg/L) for the same amount of time. RNA then was extracted, and mRNA levels of IL-1β (a), IL-6 (b), TNF-α (c), and IL-10 (d) were measured by real-time PCR. Bar graphs represent the results (mean ± SD) of three independent experiments. One-way ANOVA was applied and all the overall ANOVA was significant. # p > 0.05; p < 0.05; ∗∗ p < 0.01; and ∗∗∗ p < 0.001 when compared between selected groups.
Figure 2
Figure 2
Metformin inhibited AGEs-induced inflammatory response in BMDMs. BMDMs were divided into 5 groups: control, AGEs, AGEs + MET 0.25 (metformin 0.25 μM), AGEs + MET 1.0 (metformin 1.0 μM), and AGEs + MET 2.0 (metformin 2.0 μM). Cells in the last 3 groups were pretreated with different concentrations of metformin (0.25, 1.0, and 2.0 μM) for 60 min, respectively, and then, together with AGEs group, the 4 groups were stimulated with AGEs (200 mg/L) for 24 h. The control group was treated with BSA (200 mg/L) for the same amount of time. RNA then was extracted, and mRNA levels of IL-1β (a), IL-6 (b), TNF-α (c), and IL-10 (d) were measured by real-time PCR. Bar graphs represent the results (mean ± SD) of three independent experiments. One-way ANOVA was applied and all the overall ANOVA was significant. # p > 0.05; p < 0.05; ∗∗ p < 0.01; and ∗∗∗ p < 0.001 when compared between selected groups.
Figure 3
Figure 3
Metformin activates AMPK and inhibits AGEs-induced RAGE expression and NFκB activation. (a) BMDMs were divided into 4 groups: control, AGEs, MET, and AGEs + MET group. In AGEs group, cells were cultured with AGEs at 200 mg/L for 24 h; in MET group, cells were cultured with metformin at 2.0 μM for 24 h; in AGEs + MET group, cells were pretreated with metformin for 60 min and then cultured with AGEs at 200 mg/L for 24 h; in control group, cells were cultured with BSA at 200 mg/L for 24 h. Western blot analysis was performed to measure protein levels of RAGE and phosphorylated AMPK (p-AMPK). Tubulin was used as internal control. (b) BMDMs were pretreated with or without metformin (2.0 μM) for 60 min before AGEs (200 mg/L) stimulation for different time intervals (0, 30, 60, and 180 min). Protein levels of NFκB-p65 (p65) and phosphorylated NFκB-p65 (p-p65) were measured by western blot. Tubulin was used as internal control. Bar graphs represent the results (mean ± SD) of three independent experiments. One-way ANOVA was applied and all the overall ANOVA was significant. # p > 0.05; p < 0.05; ∗∗ p < 0.01; and ∗∗∗ p < 0.001 when compared between selected groups.
Figure 4
Figure 4
Metformin's inhibition on AGEs-induced NFκB signaling is AMPK dependent. BMDMs were divided into 4 groups: control, AGEs, AGEs + MET, and AGEs + MET + CC group. In AGEs group, cells were cultured with AGEs at 200 mg/L for 60 min; in AGEs + MET group, cells were pretreated with metformin for 60 min and then cultured with AGEs at 200 mg/L for 60 min; in AGEs + MET + C-C group, cells were pretreated with Compound C, an AMPK inhibitor, at 5 μM for 60 min, and then they were treated with metformin at 2.0 μM for 60 min followed by AGEs at 200 mg/L for 60 min; in control group, cells were cultured with BSA at 200 mg/L for 60 min. p65 nuclear translocation of each group was evaluated by immunofluorescent staining. Primary antibodies against p65 and Cy3 (red) labeled secondary antibodies were used to detect p65; DAPI (blue) was used to stain the nucleus. Bar graphs represent the results (mean ± SD) of three independent experiments. Bar = 50 μm. One-way ANOVA was applied and the overall ANOVA was significant. ∗∗ p < 0.01 and ∗∗∗ p < 0.001 when compared between selected groups.
Figure 5
Figure 5
Metformin's inhibition on AGEs-induced inflammatory response is AMPK dependent. BMDMs were divided into 4 groups: control, AGEs, AGEs + MET, and AGEs + MET + CC group. In AGEs group, cells were cultured with AGEs at 200 mg/L for 60 min; in AGEs + MET group, cells were pretreated with metformin for 60 min and then cultured with AGEs at 200 mg/L for 60 min; in AGEs + MET + C-C group, cells were pretreated with Compound C, an AMPK inhibitor, at 5 μM for 60 min, and then they were treated with metformin at 2.0 μM for 60 min followed by AGEs at 200 mg/L for 60 min; in control group, cells were cultured with BSA at 200 mg/L for 60 min. RNA then was extracted, and mRNA levels of IL-1β (a), IL-6 (b), TNF-α (c), and IL-10 (d) were measured by real-time PCR. Bar graphs represent the results (mean ± SD) of three independent experiments. One-way ANOVA was applied and all the overall ANOVA was significant. # p > 0.05; p < 0.05; ∗∗ p < 0.01; and ∗∗∗ p < 0.001 when compared between selected groups.
Figure 6
Figure 6
Metformin changes AGEs-induced surface markers expression on macrophages. BMDMs were divided into 6 groups: control, AGEs, AGEs + anti-RAGE, AGEs + PDTC, AGEs + MET, and AGEs + MET + C-C. In AGEs group, cells were cultured with AGEs at 200 mg/L for 24 h; in AGEs + anti-RAGE group, cells were pretreated with anti-RAGE neutralizing antibodies for 60 min followed by AGEs at 200 mg/L for 24 h; in AGEs + PDTC group, cells were pretreated with PDTC for 60 min followed by AGEs at 200 mg/L for 24 h; in AGEs + MET group, cells were pretreated with metformin at 2.0 μM for 60 min and then cultured with AGEs at 200 mg/L for 24 h; in AGEs + MET + C-C group, cells were pretreated with Compound C at 5 μM for 60 min, and then they were treated with metformin at 2.0 μM for 60 min followed by AGEs at 200 mg/L for 24 h; in control group, cells were cultured with BSA at 200 mg/L for the same amount of time. Single cell suspensions then were prepared. M1 surface marker CD86 and M2 surface marker CD206 were detected by flow cytometry analysis. Bar graphs represent the results (mean ± SD) of five independent experiments. One-way ANOVA was applied and all the overall ANOVA was significant. # p > 0.05; p < 0.05; and ∗∗∗ p < 0.001 when compared between selected groups.

Similar articles

Cited by

References

    1. Zeller I., Srivastava S. Macrophage functions in atherosclerosis. Circulation Research. 2014;115(12):e83–e85. doi: 10.1161/CIRCRESAHA.114.305641. - DOI - PMC - PubMed
    1. Ley K., Miller Y. I., Hedrick C. C. Monocyte and macrophage dynamics during atherogenesis. Arteriosclerosis, Thrombosis, and Vascular Biology. 2011;31(7):1506–1516. doi: 10.1161/ATVBAHA.110.221127. - DOI - PMC - PubMed
    1. Peled M., Fisher E. A. Dynamic aspects of macrophage polarization during atherosclerosis progression and regression. Frontiers in Immunology. 2014;5, article 579 doi: 10.3389/fimmu.2014.00579. - DOI - PMC - PubMed
    1. Fadini G. P., Cappellari R., Mazzucato M., Agostini C., Vigili De Kreutzenberg S., Avogaro A. Monocyte-macrophage polarization balance in pre-diabetic individuals. Acta Diabetologica. 2013;50(6):977–982. doi: 10.1007/s00592-013-0517-3. - DOI - PubMed
    1. Fadini G. P., De Kreutzenberg S. V., Boscaro E., et al. An unbalanced monocyte polarisation in peripheral blood and bone marrow of patients with type 2 diabetes has an impact on microangiopathy. Diabetologia. 2013;56(8):1856–1866. doi: 10.1007/s00125-013-2918-9. - DOI - PubMed

MeSH terms

LinkOut - more resources