. 2015:2015:206405.
doi: 10.1155/2015/206405.

Evaluating pH in the Extracellular Tumor Microenvironment Using CEST MRI and Other Imaging Methods

Affiliations

Evaluating pH in the Extracellular Tumor Microenvironment Using CEST MRI and Other Imaging Methods

Liu Qi Chen et al. Adv Radiol. 2015.

Abstract

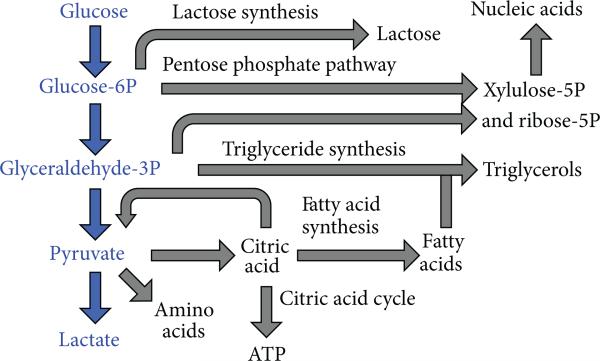
Tumor acidosis is a consequence of altered metabolism, which can lead to chemoresistance and can be a target of alkalinizing therapies. Noninvasive measurements of the extracellular pH (pHe) of the tumor microenvironment can improve diagnoses and treatment decisions. A variety of noninvasive imaging methods have been developed for measuring tumor pHe. This review provides a detailed description of the advantages and limitations of each method, providing many examples from previous research reports. A substantial emphasis is placed on methods that use MR spectroscopy and MR imaging, including recently developed methods that use chemical exchange saturation transfer MRI that combines some advantages of MR spectroscopy and imaging. Together, this review provides a comprehensive overview of methods for measuring tumor pHe, which may facilitate additional creative approaches in this research field.


Figures

Figure 1
Figure 1
Schematic of glycolysis and associated metabolic pathways that create biomolecules for tumor growth. Adapted from [2].
Figure 2
Figure 2
Tumor acidosis causes chemoresistance against weak-base drugs. (a) Uptake and retention of mitoxantrone, a weak-base drug, was greater in C3H tumor tissue that was neutralized with sodium bicarbonate. (b) Mitoxantrone treatment (1 dose of 12 mg/kg or 2 doses of 6 mg/kg) caused a greater growth delay when sodium bicarbonate neutralized the tumor acidosis. (c) Sodium bicarbonate also improved survival with mitoxantrone treatment. Reproduced with permission from [10].
Figure 3
Figure 3
Treatment of a mouse model of β-galactosidase-labeled MDA-MB-231 mammary carcinoma with 200 mM NaHCO3 ad libitum for 60 days resulted in lower lung metastases as evidenced by (a) β-galactosidase-induced fluorescence staining of lung lesions and (b) the number of lesion pixels per animal. Reproduced with permission from [14].
Figure 4
Figure 4
A pH microelectrode for measuring in vivo tumor pH. (a) A photo of an angled glass electrode with a platinum wire and 0.1 N hydrochloric acid electrolyte. (b) The microelectrode was inserted into a melanoma nodule of a patient, stabilized with sponge rubber between the skin and electrode shaft, and secured with adhesive tape. A calomel reference electrode was secured to the skin. Adapted from [16] with permission.
Figure 5
Figure 5
Fluorescence imaging of tumor pHe. (a) The emission spectrum of SNARF-1 dye shows that pH is correlated with the ratio of the fluorescence signal at 570/650 nm. (b) A window chamber model can access a solid tumor growing under a coverslip in a skinfold. (c) The parametric map of pHe was determined from the ratio of fluorescence signals of SNARF-1 dye in an in vivo window chamber model of a HCT116-GFP tumor. Black and purple arrows indicate acidic environment toward which the tumor is growing. The pHe values of the tumor edge are listed near short red lines. Reproduced with permission from [–21].
Figure 6
Figure 6
PET imaging of tumor pHe. (a) A pHLIP peptide inserts into cell membranes in low pHe conditions. (b) PET imaging of 64Cu-DOTA-pHLIP showed higher uptake and retention in a subcutaneous mouse model of LNCaP relative to PC-3, indicating that the LNCaP tumor model had lower pHe. MR spectroscopy confirmed that the average pHe values of the LNCap and PC-3 tumor models were 6.78 ± 0.29 and 7.23 ± 0.10, respectively. White circles show the locations of the subcutaneous tumors. (c) A membrane-insertion of a variation of pHLIP shows a sigmoidal dependence on pH. Reproduced with permission from [–24].
Figure 7
Figure 7
EPR imaging of pH. The nitroxide radical TEMPO shows strong EPR signals in solution, which are quenched when TEMPO is encapsulated in a nanoparticle. (a) Degradation of the nanoparticle at low pH dequenches the EPR signals from TEMPO. (b) No change in the nanoparticle at neutral pH retains the EPR-quenched state. (c) Phantom images demonstrate that the difference in pH can be spatially localized. Reproduced with permission from [33].
Figure 8
Figure 8
1H MR spectroscopic imaging of tumor pHe. (a) The 1H spectrum from within a glioma showed the chemical shift of the IEPA H2 resonance (arrow), (b) which is correlated with pH as shown by an in vitro titration. (c) A parametric map of IEPA signal amplitudes showed accumulation of the agent in the glioma. (d) A parametric map of pHe was determined from the chemical shift of the IEPA H2 resonance and the correlation shown in (b). Reproduced with permission from [34].
Figure 9
Figure 9
31P MR spectroscopy of tumor pHe. (a) The 31P spectrum from mouse leg muscle injected with 3-APP can measure extracellular pH (pHe) from the 3-APP chemical shift and can measure intracellular pH (pHi) from the chemical shift of inorganic phosphate (Pi). (b) The 31P chemical shift of 3-APP is correlated with pH as shown by an in vitro titration. (c) The pHe and pHi measured with 3-APP and Pi in a tumor before (bottom) and after (middle) injection of 3-APP, and after euthanasia (top). Reproduced with permission from [41].
Figure 10
Figure 10
19F MR spectroscopy of tumor pHe. (a) The 19F MR spectrum of ZK-150471 shows two peaks. (b) The chemical shift difference of these two peaks is correlated with pH. (c) The average pHe measured with 19F MRS showed a decrease after heating with and without 5 mg/kg hydralazine. Reproduced with permission from [42].
Figure 11
Figure 11
Hyperpolarized 13C MR spectroscopic imaging of tumor pHe. (a) 13C MR spectroscopy was used to measure the ratio of [H13CO3]/[13CO2], which was used to calculate pH based on the Henderson-Hasselbalch equation, pH = pKa + log10([H13CO3]/[13CO2]). (b) A solid line shows the correlation of the pH values determined from 13C MRS and an electrode. The dashed line representing equal measurements is provided as a visual reference. (c) A subcutaneously implanted EL4 tumor in a mouse is outlined in red in an axial MR image. (d) The pH map of the same mouse calculated from 13C MR spectroscopic imaging. The tumor margin is outlined in white. Reproduced with permission from [48].
Figure 12
Figure 12
Relaxation-based MRI of Gd-DOTA-4Amp and DyDOTP can measure tumor pHe. (a) The change in water linewidth before injection (left) and after injection (right) is used to estimate the concentration of the agent. (b) A parametric map of the r1 relaxivity of the agent in a glioma model is obtained from a T1-weighted MR images and the concentration of the agent. (c) The r1 relaxivity of the agent is pH-dependent, (d) which can be used to convert the r1 relaxivity map to a pH map (color scale bar shows pH units). Reproduced from [53] with permission.
Figure 13
Figure 13
Chemical exchange saturation transfer. (a) The number of magnetic moments aligned with the B0 static magnetic field is greater than the number aligned against the B0 field for an amide proton and a water proton. (b) Selective saturation of the MR frequency of the amide proton causes the magnetic moments to equilibrate between states. (c) Subsequent chemical exchange of the amide proton and water proton transfers some of the saturation to the water protons, causing a partial equilibration of the states for the water protons. (d) The CEST-FISP MRI protocol consists of a series of Gaussian-shaped saturation pulses repeated “m” times, followed by a FISP MRI acquisition sequence. The entire process is repeated for a series of “n” saturation frequencies. (e) Fourier transformation of the frequency-domain signals creates a series of “n” MR images at each saturation frequency. (f) The integral of the MR signal of the tumor is plotted as a function of saturation frequency for the “n” images, creating a CEST spectrum. A sum of four Lorentzian line shapes was fit to the experimental CEST spectrum to quantify the CEST effects at 5.6, 4.2, and 0.8 ppm of the CEST agent used in this example (iopromide; Ultravist, Bayer Healthcare Inc.) and also account for the direct saturation of water at 0 ppm (black line, raised 10% above the CEST spectral peaks to improve the view).
Figure 14
Figure 14
Endogenous CEST MRI of tumor pHi. (a) The asymmetry of the magnetization transfer ratio (MTRasym), a measure of CEST, decreases after ischemia is induced in a rat model (black: ischemic region; green: nonischemic contralateral region; data represents the average and standard deviation of results with 7 rats). (b) This decrease in CEST, also represented as a change in the amide proton transfer ration (ΔAPTR), has been correlated with intracellular pH (pHi) as measured with 31P MR spectroscopy. (c) The MTRasym can be mapped in a rat model of ischemia, (d) which can be converted into a pH map. Reproduced with permission from [59, 83, 84].
Figure 15
Figure 15
CEST MRI of tumor pHe with Yb-HPDO3A. (a) An in vivo CEST spectrum of the tumor mass before and after i.v. injection of the agent into a mouse model of B16-F10 melanoma. (b) A ratio of the two CEST effects is calibrated with pH at 33°C. Although the calibration is dependent on temperature, the temperature can be determined from the chemical shifts of the CEST effects. (c) An anatomical image shows the location of the subcutaneous tumor. (d) The pixelwise pHe map of the tumor shows a heterogenous distribution of pHe values with an average pHe of 5.8. Reproduced with permission from [61].
Figure 16
Figure 16
CEST MRI of tumor pHe with Yb-DO3A-oAA. (a) The CEST spectrum of Yb-DO3A-oAA was fitted with Lorentzian line shapes to measure two CEST effects. (b) A ratio of the CEST effects was linearly correlated with pH. (c) The same CEST ratio was measured in a MCF-7 mammary carcinoma model after direct injection of the agent into the tumor tissue. (d) A map of extracellular pH (pHe) was determined from the map of the CEST ratio. (e) The pHe map was filtered to only retain results from pixels that had two statistically significant CEST amplitudes, resulting in a pHe map of the tumor and tube containing the agent (the other tube contained only water). Reproduced with permission from [57].
Figure 17
Figure 17
CEST MRI of leg pHe with Tm-DOTAM-Gly-Lys. (a) An in vivo CEST spectrum of the tumor mass before and after direct injection of the agent into the left mouse leg. (b) The linewidth of the CEST effect is calibrated with pH. (c) The in vivo pHe map and (d) the in vivo temperature map are superimposed onto a preinjection anatomical image. The temperature is determined from the chemical shift of the CEST effect. Reproduced with permission from [62, 63].
Figure 18
Figure 18
CEST MRI of tumor pHe with iopamidol. (a) A CEST spectrum the agent shows two CEST effects at 4.2 and 5.5 ppm. Both CEST effects are dependent on saturation conditions, which indicates that CEST MRI measurements of pH should be performed with optimized saturation conditions for best results. (b) The calculated pH based on a ratio of the CEST effects is correlated with experimental pH measured with an electrode. (c) An anatomical image shows the locations of the kidneys. (d) The pixelwise pHe map of the kidneys shows a homogenous distribution of pHe values with an average pHe of 5.8. Reproduced with permission from [66, 98].
Figure 19
Figure 19
Tumor pHe measured with acidoCEST MRI using iopromide. (a) The CEST spectra of the agent show that the two CEST effects at 4.2 and 5.6 ppm are dependent on pH. (b) A log10 ratio of the two CEST effects is linearly correlated with pH as measured with a microelectrode. (c, d) The pixelwise pHe map of a mouse bearing a Raji xenograft tumor before and after treatment with MIBG, a midrocondrial poison that causes acidification. Colored pixels have acidic pHe values ≤ 7.0 that correspond to the color-bar. White pixels represent tumor regions with only a single CEST effect at 4.2 ppm, which were considered to have neutral pHe values > 7.0. Reproduced with permission from [68].

Similar articles

Cited by

References

    1. Hanahan D, Weinberg RA. Hallmarks of cancer: the next generation. Cell. 2011;144(5):646–674. - PubMed
    1. Beddek AJ, Rawson P, Peng L, et al. Profiling the metabolic proteome of bovine mammary tissue. Proteomics. 2008;8(7):1502–1515. - PubMed
    1. Warburg O. On the origin of cancer cells. Science. 1956;123(3191):309–314. - PubMed
    1. Heiden MGV, Cantley LC, Thompson CB. Understanding the Warburg effect: the metabolic requirements of cell proliferation. Science. 2009;324(5930):1029–1033. - PMC - PubMed
    1. Gillies RJ, Raghunand N, Garcia-Martin ML, Gatenby RA. pH imaging. IEEE Engineering in Medicine and Biology Magazine. 2004;23(5):57–64. - PubMed