. 2016 Oct 20:7:13161.
doi: 10.1038/ncomms13161.

Peak-ring structure and kinematics from a multi-disciplinary study of the Schrödinger impact basin

Affiliations

Peak-ring structure and kinematics from a multi-disciplinary study of the Schrödinger impact basin

David A Kring et al. Nat Commun. .

Abstract

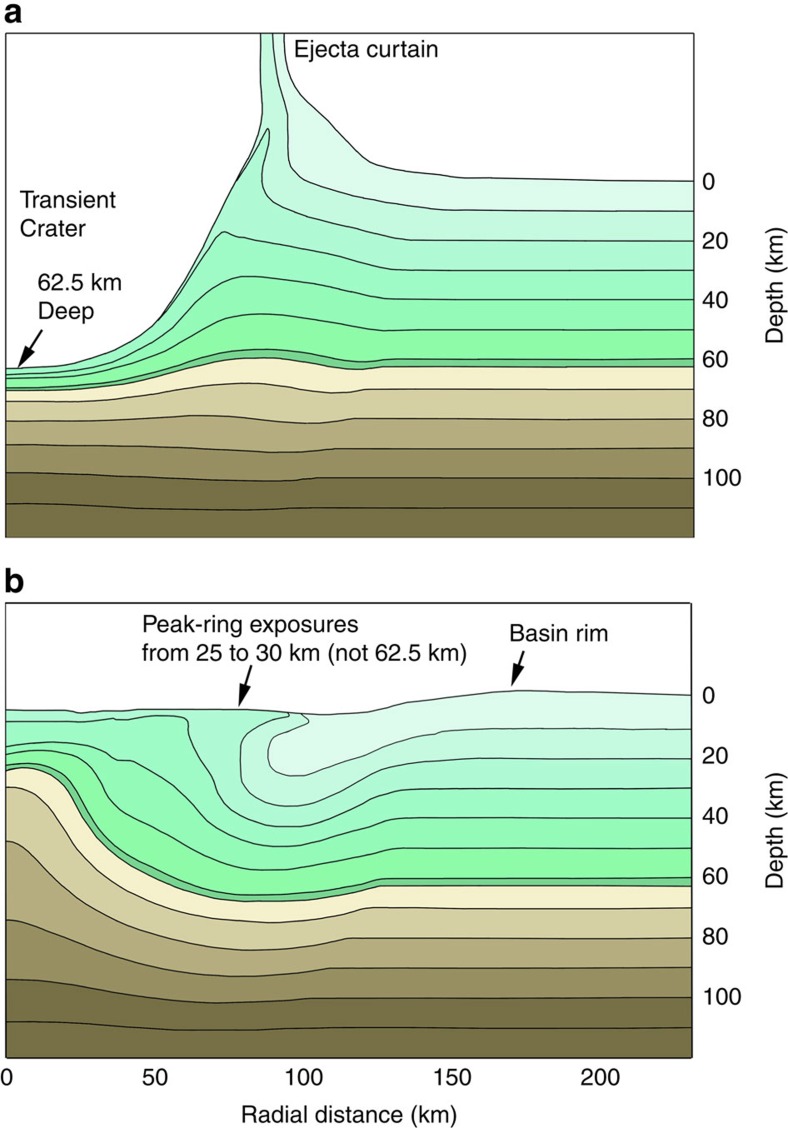
The Schrödinger basin on the lunar farside is ∼320 km in diameter and the best-preserved peak-ring basin of its size in the Earth-Moon system. Here we present spectral and photogeologic analyses of data from the Moon Mineralogy Mapper instrument on the Chandrayaan-1 spacecraft and the Lunar Reconnaissance Orbiter Camera (LROC) on the LRO spacecraft, which indicates the peak ring is composed of anorthositic, noritic and troctolitic lithologies that were juxtaposed by several cross-cutting faults during peak-ring formation. Hydrocode simulations indicate the lithologies were uplifted from depths up to 30 km, representing the crust of the lunar farside. Through combining geological and remote-sensing observations with numerical modelling, we show that a Displaced Structural Uplift model is best for peak rings, including that in the K-T Chicxulub impact crater on Earth. These results may help guide sample selection in lunar sample return missions that are being studied for the multi-agency International Space Exploration Coordination Group.


Figures

Figure 1
Figure 1. Exposed peak ring.
Orbital perspective of the ∼320 km diameter Schrödinger basin on the lunar farside, looking from the north towards the south pole, with a 1–2.5 km-high peak ring rising from the basin floor. The box indicates the area mapped in Fig. 2. NASA's Scientific Visualization Studio. We follow the lunar convention of referring to this impact structure as a basin, rather than a crater, because it contains a peak ring and has a diameter that exceeds 300 km.
Figure 2
Figure 2. Mapped segment of the impact basin peak ring.
(a) Lithologies derived from M3 spectra draped over an LRO Wide-Angle Camera (WAC) image of the study area. Endmember anorthositic rocks are blue, noritic rocks are red and troctolitic rocks are green; intermediate compositions have intermediate colours. Some areas in shadow in the background WAC image used for context were illuminated when M3 spectra were collected. For details of the M3 spectral analyses, we refer readers to Kramer et al.. (b) Geologic map of focus region showing faults, lithological boundaries and talus slope derived by integrating M3 results with photogeologic analyses of LRO WAC and NAC images. Letters identify key features: A, B and C=noritic peaks; D, E, F and G=troctolitic ridges and summits; H=pyroxene-bearing anorthosite adjacent to noritic unit; I=transitions from pyroxene-bearing anorthosite to pure anorthosite to olivine-rich troctolitic outcrops; J=contacts between troctolitic outcrops and pure anorthositic outcrops. Numbers identify structural elements: 0=graben and 1–4=transecting faults. A key for the color scheme is included on the map. The black area is permanently shadowed, so no images or reflectance spectral data was available. Scale bars, 10 km long (a,b). The region mapped is bounded by a rectangle with an upper left corner located at 74.7°S, 122.6°E and a lower right corner at 75.7°S, 126.3°E.
Figure 3
Figure 3. Impact simulations.
Five time-steps of the Schrödinger basin impact event modeled using the iSALE hydrocode. The crust is coloured brown and the mantle is coloured grey. (ae) Left: the basin-forming event assuming a 20 km-thick target crust, which may better represent the far eastern side of the basin (beyond the study area). (fj) Right: the basin-forming event assuming a 40 km-thick target crust, which best represents the side of the basin that produced the massifs in the study area. The cell size is 625 m and there were 20 cells per projectile radius. Arrows highlight the general movement of material during basin formation. (f) is shown in a simplified form in Fig. 8a; in j is shown in a simplified form in Fig. 8b.
Figure 4
Figure 4. Cumulative volume of peak ring material originating above a depth d0.
In the simulation with a 20 km-thick crust in the target, all of the peak-ring lithologies are derived from depths <20 km. In the simulation with a 40 km-thick crust in the target, some of those lithologies can be derived from slightly more than 25 km depth. Interestingly, we do not see a qualitative difference in the distribution of anorthositic, noritic and troctolitite lithologies across the basin. That is, the same lithologies mapped in Fig. 2 are also seen in other portions of the peak ring, implying that they may occupy a range of depths in the crust.
Figure 5
Figure 5. Shock-pressure distribution.
Cross-sections with simulation results for a 20 km-thick target crust (left panel) and 40 km-thick target crust (right panel) with maximum shock pressures indicated in a graduated scale from 12 to 80 GPa. Material that experienced maximum shock pressures less than 12 GPa are not highlighted by pressure and are instead highlighted by material, with crust shaded light grey and mantle shaded dark grey.
Figure 6
Figure 6. Cumulative volume of peak-ring material that experienced shock pressures in excess of Ps.
The results for simulations involving targets with a 20 km-thick crust and 40 km-thick crust are shown. Here the volume of the peak ring is defined as the material within 2 km of the surface, which facilitates comparison with the observed portion of the peak ring and the material that future missions can potentially sample.
Figure 7
Figure 7. The kinematic flow of material that forms the peak ring.
The flow of material is tracked for the (a) 20 km-thick crust scenario and (b) 40 km-thick crust scenario. The black dot tracks the tracer that ends up closest to the middle of the peak ring; the point at the other end of the line tracks the tracer that starts 2 km below the black dot. Hence, the length and orientation of the line shows the separation and orientation of material that was originally 2 km apart and vertically aligned and becomes stretched and rotated to horizontal through excavation, collapse and uplift.
Figure 8
Figure 8. Structural relationships in the Schrödinger basin iSALE hydrocode simulation.
(a) Time-step at 2.5 min that shows the transient crater depth. It is colour coded to show that relatively shallow units are carried downward to the base of the transient crater. The transient crater radius was 80 km in a target with a crustal thickness of 40 km appropriate for the western side of the basin. (b) Time-step at 41.7 min showing the final emplacement and configuration of the peak ring. Results are shaded in 10 km-thick increments and a colour transition between green and brown is used to indicate target units that were stratigraphically above and below the transient crater depth of 62.5 km.

References

    1. Ohtake M. et al.. The global distribution of pure anorthosite on the Moon. Nature 461, 236–240 (2009). - PubMed
    1. Yamamoto S. et al.. Olivine-rich exposures in the South Pole-Aitken Basin. Icarus 218, 331–344 (2012).
    1. Kramer G. Y., Kring D. A., Nahm A. L. & Pieters C. M. Spectral and photogeologic mapping of Schrödinger Basin and implications for the post-South Pole-Aitken impact deep subsurface stratigraphy. Icarus 223, 131–148 (2013).
    1. Potter R. W. K., Collins G. S., Kiefer W. S., McGovern P. J. & Kring D. A. Constraining the size of the South Pole-Aitken basin impact. Icarus 220, 730–743 (2012).
    1. Ohtake M. et al.. Geologic structures generated by large-impact basin formation observed at the South Pole-Aitken basin on the Moon. Geophys. Res. Lett. 41, 2738–2745 (2014).

Publication types