. 2016 Oct 20:6:35497.
doi: 10.1038/srep35497.

Protease induced plasticity: matrix metalloproteinase-1 promotes neurostructural changes through activation of protease activated receptor 1

Affiliations

Protease induced plasticity: matrix metalloproteinase-1 promotes neurostructural changes through activation of protease activated receptor 1

Megan Allen et al. Sci Rep. .

Abstract

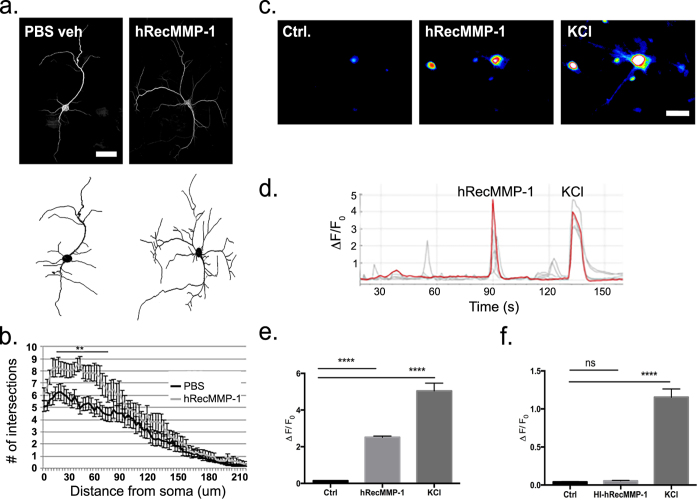
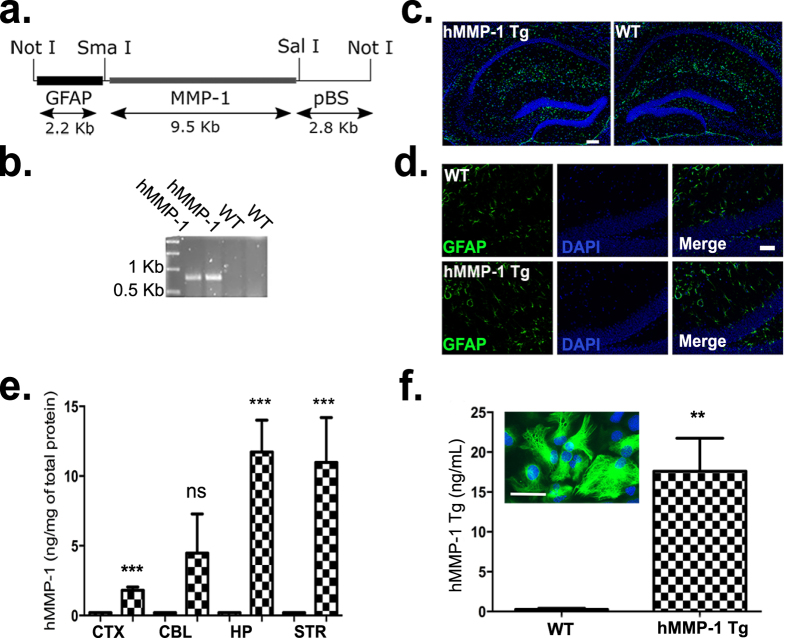
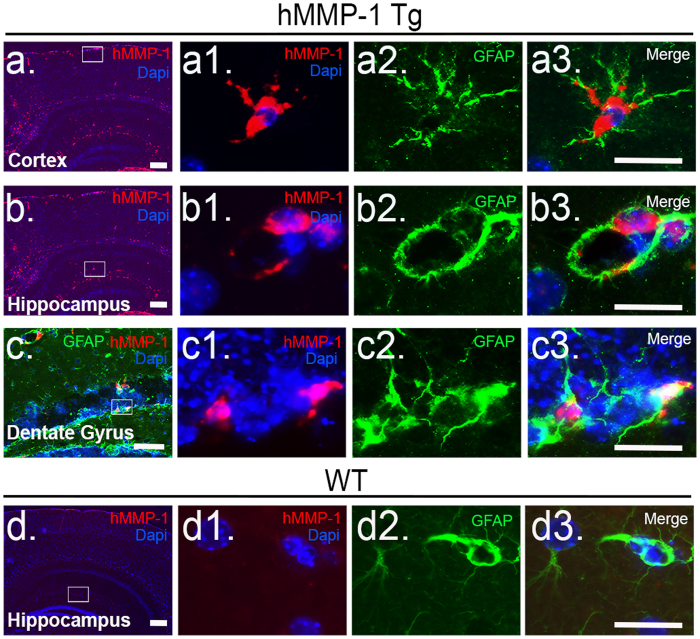
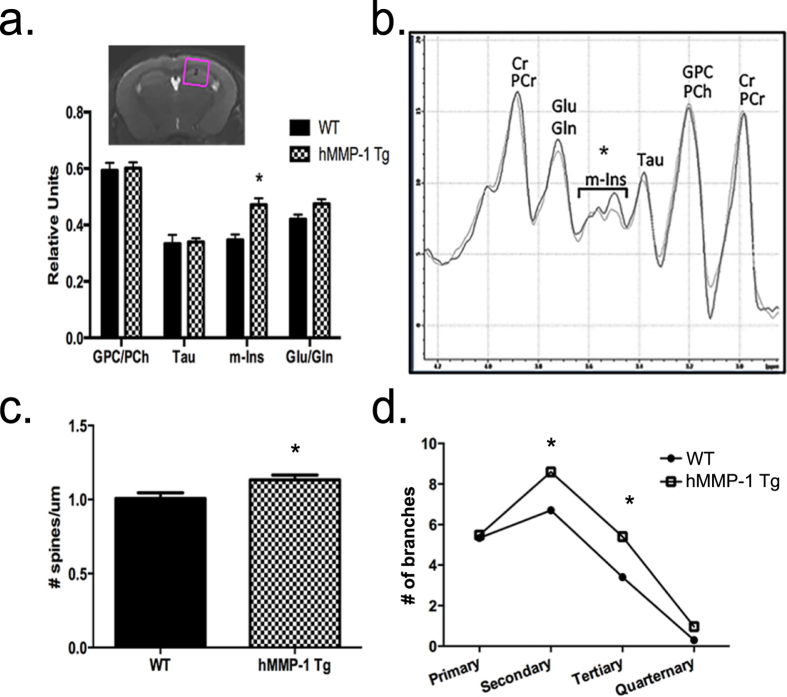
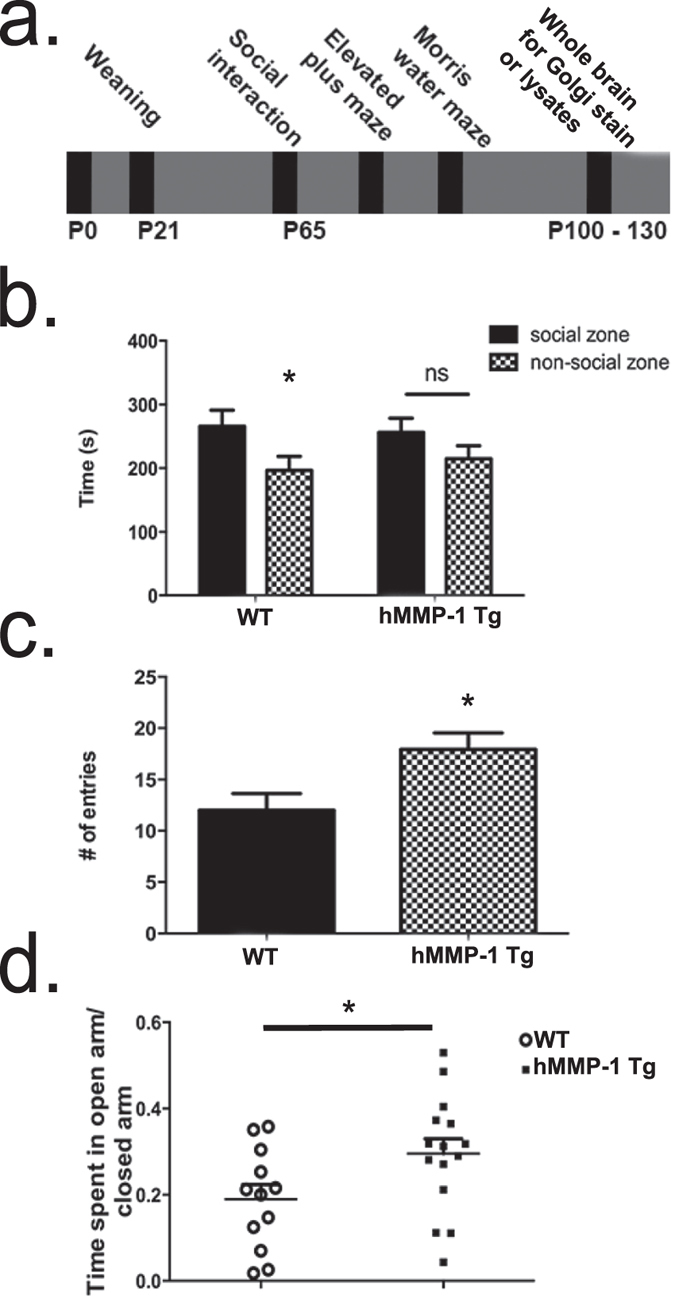
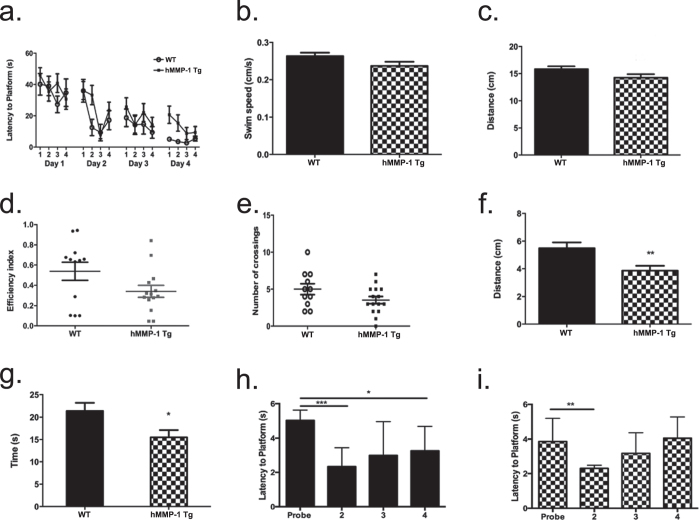
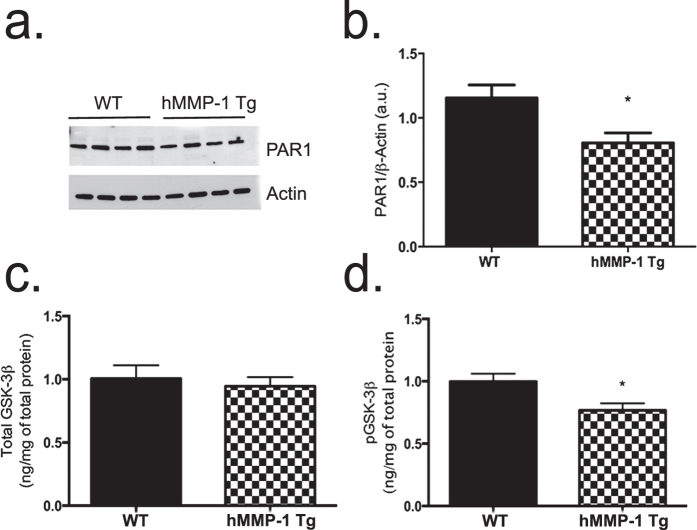
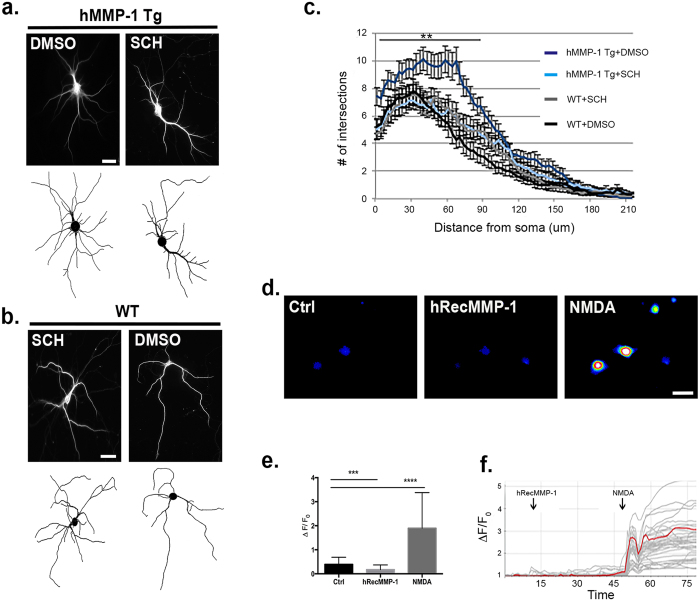
Matrix metalloproteinases (MMPs) are a family of secreted endopeptidases expressed by neurons and glia. Regulated MMP activity contributes to physiological synaptic plasticity, while dysregulated activity can stimulate injury. Disentangling the role individual MMPs play in synaptic plasticity is difficult due to overlapping structure and function as well as cell-type specific expression. Here, we develop a novel system to investigate the selective overexpression of a single MMP driven by GFAP expressing cells in vivo. We show that MMP-1 induces cellular and behavioral phenotypes consistent with enhanced signaling through the G-protein coupled protease activated receptor 1 (PAR1). Application of exogenous MMP-1, in vitro, stimulates PAR1 dependent increases in intracellular Ca2+ concentration and dendritic arborization. Overexpression of MMP-1, in vivo, increases dendritic complexity and induces biochemical and behavioral endpoints consistent with increased GPCR signaling. These data are exciting because we demonstrate that an astrocyte-derived protease can influence neuronal plasticity through an extracellular matrix independent mechanism.


Figures

Figure 1
Figure 1. Application of hRecMMP-1 increases dendritic tree complexity as well as intracellular Ca2+ in primary culture.
Immunocytochemical (ICC) labeling of hippocampal neuronal cytoskeleton with MAP2 antibody was performed to visualize cell morphology of neurons at DIV14, and representative images are shown in (a): PBS vehicle control and hRecMMP-1 (8 nM) treated (scale bar = 25 μm). Digitized traces used for Sholl analysis for each corresponding neuron are shown below ICC images. Results from Sholl analysis reveal hRecMMP-1 treatment significantly increases the number of intersections at all distances from 9 μm–72 μm away from soma (PBS Veh n = 20 neurons, hRecMMP-1 n = 20 neurons; ANOVA with Bonferroni’s multiple comparisons post-test, **p value ≤ 0.01) (b). To investigate Ca2+ flux, live cell imaging was performed on cultures enriched for neurons at DIV18. Representative Fluo-4 AM fluorescent images captured during application of control buffer, 40 nM hRecMMP-1, and 50 mM KCl are shown in (c). Individual Ca2+ traces for each neuron from one representative experiment are shown in (d) with a single neuronal response highlighted in red. We quantify peak ΔF/F0 Ca2+ responses in (e) (n = 297 cells per condition; mean, ±SEM as follows: Ctrl 0.15 ± 0.01, hRecMMP-1 2.51 ± 0.06, KCl 5.05 ± 0.43; ANOVA with Bonferroni’s multiple comparisons post tests, ****p value ≤ 0.0001). Heat inactivated hRecMMP-1 (HI-hRecMMP-1, 40 nM) was administered in addition to control buffer and 50 mM KCl, and quantified peak ΔF/F0 Ca2+ responses are shown in (f) (n = 60 cells per condition; mean, ±SEM as follows: Ctrl 0.04 ± 0.01, HI-hRecMMP-1 0.06 ± 0.01, KCl 1.15 ± 0.11; ANOVA with Bonferroni’s multiple comparisons post-tests, significant p value ≤ 0.0001 and non-significant p value ≥ 0.05).
Figure 2
Figure 2. Generation and characterization of human MMP-1 transgenic mouse (hMMP-1 Tg).
A schematic diagram of the construct used for pronuclear injections is shown in (a). The murine GFAP promoter drives human MMP-1 expression in the transgenic model. To verify transgene presence, hMMP-1 was amplified by genomic PCR and a representative result is shown in (b). GFAP immunofluorescent reactivity in WT and hMMP-1 Tg brains are shown in (c,d) GFAP (Green), Dapi (blue). Mean hMMP-1 protein levels (ng/mg of total protein) in discrete brain regions were measured by ELISA and are quantified in (e). hMMP-1 levels in WT (n = 7) brain regions are not detected. Mean and ±SEM for hMMP-1 Tg (n = 8) brain regions: Cortex (CTX) 1.18, ±0.23; Cerebellum (CBL) 4.47, ±2.80; Hippocampus (HP) 11.71, ±2.29; Striatum (STR) 10.96, ±3.22 (Student’s t-test; ***p value ≤ 0.001, **p value ≤ 0.01, ns denotes a p value > 0.05). To ensure that astrocytes secrete hMMP-1, supernatants from primary astrocyte cultures were tested for the presence of hMMP1 by ELISA in (f) (WT n = 4, levels not detected; hMMP1 Tg n = 4, hMMP-1 mean, ±SEM: 17.60 ng/mL, ±4.14; Student’s t-test, **p value = 0.005. The inset contains a representative image of cultured cortical astrocytes; GFAP immunocytochemistry confirmed 95% of the cells were GFAP positive. Scale bars = 200 μm (c), 100 μm (d), 25 μm (f).
Figure 3
Figure 3. Concurrent expression of hMMP-1 mRNA and GFAP protein.
Brain coronal sections were assayed for the presence of hMMP-1 mRNA (red), GFAP protein (green), and DAPI nuclei (blue) in hMMP-1 Tg and WT animals. We highlight several regions of interest (a–d). Low magnification images show the distribution of cells that concurrently express hMMP-1 mRNA as well as GFAP protein in hMMP-1 Tg mouse brain (a–c). White boxes (a–d) indicate the region of interest for high power views. These high magnification views show cortical GFAP positive astrocytes with a hMMP-1 mRNA signal (a1–a3), and a stereotypical astrocytic foot process surrounding a blood vessel in the hippocampus that espressses both GFAP and hMMP-1 mRNA (b1–b3). Lastly, GFAP positive cells expressing hMMP-1 mRNA in the hippocampal dentate gyrus are also shown (c1–c3). Notably, hMMP-1 mRNA is not present in WT littermate control brain (d), GFAP positive cells lacking hMMP-1 mRNA are shown in (d1–d3). Scale bars: 200 μm (a,b,d), 50 μm (c), and 20 μm (a1–a3, b1–b3, c1–c3, d1–d3).
Figure 4
Figure 4. Increased levels of the glial activation marker, myo-inostiol (m-Ins), coincide with changes in neuronal morphology.
We show a representative image of a mouse brain highlighting the region of interest analyzed for metabolite levels (a, inset, pink box) by in vivo1H MR. Comparisons in spectra from hMMP-1 Tg (n = 6) and WT (n = 6) were normalized to total creatine (a,b). (Mean, ±SEM are as follows: Cho WT 0.59, ±0.07, hMMP-1 Tg 0.60, ±0.05; Tau WT 0.33, ±0.08, hMMP-1 Tg 0.34, ±0.03; myo-I WT 0.35, ±0.04, hMMP-1 Tg 0.47, ±0.06; Glu/Gln WT 0.42, ±0.04, hMMP-1 Tg 0.48, ±0.04. Statistics: 2-way ANOVA with Bonferonni’s post test; p value ≤ 0.05. Abbreviations: Cr, creatine; PCr, phosphocreatine; Glu, glutamate; Gln, glutamine; m-Ins, myo-Inositol; Tau, taurine; GPC, glycerophosphocholine; PCH, phosphocholine). To examine neuronal morphology in vivo, the Golgi impregnation technique was performed. We find increased spine density on apical dendrites of CA1 hippocampal pyramidal cells in hMMP-1 Tg when compared to WT littermate controls (c) (WT n = 56 dendrites from 15 neurons per animal from 4 animals, excluded 4 dendrites because out of focus; hMMP1 Tg n = 80 dendrites from 16 neurons per animal from 5 animals; Mean followed by ±SEM: WT 1.01 ± 0.03, hMMP-1 Tg 1.13 ± 0.03; Student’s t-test *p value = 0.02). Also, hMMP-1 Tg animals exhibited a significantly higher number of secondary and tertiary dendrites from pyramidal neurons in layer IV/V of the somatosensory cortex (d) (hMMP-1 Tg n = 3 animals and WT n = 3 animals; mean followed by ±SEM: WT primary 5.33 ± 0.22, secondary 6.70 ± 0.41, tertiary 3.41 ± 0.63, quaternary 0.30 ± 0.14, hMMP-1 Tg primary 5.48 ± 0.26, secondary 8.60 ± 0.42, tertiary 5.41 ± 0.66, quaternary 0.96 ± 0.28; ANOVA, *p value ≤ 0.05).
Figure 5
Figure 5. hMMP-1 Tg animals exhibit deficits in behaviors associated with synaptic plasticity.
A schematic diagram (a) of an experimental timeline showing behavioral tests performed in order of low to high stress. Sociability testing reveals hMMP-1 Tg show no significant preference for social stimulus as compared to WT littermate controls (b) (WT n = 10, Student’s t-test *p value = 0.05; hMMP-1 Tg n = 14, Student’s t-test p value = 0.18), elevated plus maze results show decreased anxiety as noted by significantly more entries into the open arm region of the apparatus (c) (WT n = 12, hMMP-1 Tg n = 15; Student’s t-test *p value = 0.01) as well as (d) time spent in the open arm relative to the total time of the test (Student’s t-test *p value = 0.04).
Figure 6
Figure 6. hMMP-1 Tg animals display deficits in learning and memory on the Morris water maze.
Results from Morris water maze testing (WT n = 11; hMMP-1 Tg n = 15) are presented in (a–i). (a) We find no statistical differences in the latency to locate the hidden platform during training (a) (4 trials administered for 4 consecutive days) suggesting both groups were able to perform task and indicating an appropriate level of training (2-way ANOVA p value > 0.05). On the fifth day, the hidden platform was removed and several endpoints were measured. Swim speed (b) and total distance travelled (c) during the probe trial are not significantly altered between the WT and hMMP-1 Tg suggesting that motor impairments do not account for differences observed during probe trial (Student’s t-test p value > 0.05). hMMP-1 Tg exhibited decreased path efficiency (d) Student’s t-test p value = 0.07) as well as crossings over the area that formerly housed the platform (e) Student’s t-test p value = 0.09). Notably, hMMP-1 Tg animals travel significantly less in the quadrant that formerly housed the invisible platform (f) (Student’s t-test **p value = 0.01) and spend less time in this quadrant (g) (Student’s t-test *p value = 0.03) when compared to WT littermate controls. Times spent in all quadrants during the probe trial, which tests reference memory, are presented for WT animals in (h) and hMMP-1 Tg animals in (i).
Figure 7
Figure 7. PAR1 is activated in hMMP-1 Tg animals.
Western blot analysis shows PAR1 protein levels in cortical/hippocampal lysates. A representative image of the western blot is shown (a). Quantification with densitometry is shown in (b) (WT n = 4, hMMP-1 Tg n = 4; mean followed by ±SEM: WT 1.16 ± 0.10, hMMP-1 Tg 0.81 ± 0.10; Student’s t test, *p value = 0.03). Results in (c,d) show that GSK-3β activity is increased in mice that overexpress hMMP-1. We assayed hippocampal lysates and detected total GSK-3β and phospho-GSK-3β at serine 9 by ELISA. Decreased phosphorylation at serine 9 activates the kinase (Total GSK-3β: WT n = 17, hMMP-1 Tg n = 21, mean followed by ±SEM: WT 1.00 ± 0.10, hMMP-1 Tg 0.94 ± 0.07; Student’s t test, p value = 0.62; pGSK-3β: WT n = 14, hMMP-1 Tg n = 21, mean followed by ±SEM: WT 1.00 ± 0.06, hMMP-1 Tg 0.77 ± 0.05; Student’s t test, *p value = 0.01).
Figure 8
Figure 8. PAR1 inhibition and genetic deletion reverse MMP-1 induced effects on neuronal morphology and Ca2+ flux.
Representative images from neurons cultured from hMMP-1 Tg and WT animals treated with DMSO vehicle control or a PAR1 inhibitor (SCH79797; SCH) after immunofluorescent labeling of neuronal cytoskeleton with MAP2 antibody at DIV14 (a,b). The digitized trace used for Sholl analysis for each corresponding neuron is shown below. Results from Sholl analysis reveal that neurons cultured from hMMP-1 Tg animals have a significantly increased number of intersections from 0 μm to 90 μm from cell soma when compared to hMMP-1 Tg + SCH, WT + SCH, and WT + DMSO groups (c) (hMMP-1 Tg + DMSO n = 20 neurons, hMMP-1 Tg + SCH n = 20 neurons, WT + SCH n = 20 neurons, WT + DMSO n = 20 neurons; ANOVA with Dunnett’s post-tests, **p value ≤ 0.01). To measure Ca2+ flux, live cell calcium imaging was performed on cultures enriched for neurons derived from PAR1 KO pups at DIV18 (d,e). We recorded during application of control, 40 nM hRecMMP-1, and 50 nM NMDA. Representative still images taken during application are shown in (d). The mean peak of ΔF/F0 Ca2+ responses from each cell is quantified in (e) (N = 65 cells per each condition, normalized mean, SEM: Ctrl 0.39 ± 0.04, hRecMMP-1 0.17 ± 0.03, NMDA 1.90 ± 0.22; ANOVA with Bonferroni’s multiple comparisons post tests, ***p value ≤ 0.001 and ****p value ≤ 0.0001). Calcium traces for individual neurons from one experiment are shown in gray and a representative trace is highlighted in red (f).

Similar articles

Cited by

References

    1. Wiera G., Wozniak G., Bajor M., Kaczmarek L. & Mozrzymas J. W. Maintenance of long-term potentiation in hippocampal mossy fiber-CA3 pathway requires fine-tuned MMP-9 proteolytic activity. Hippocampus 23, 529–543, 10.1002/hipo.22112 (2013). - DOI - PubMed
    1. Michaluk P. et al.. Influence of matrix metalloproteinase MMP-9 on dendritic spine morphology. J Cell Sci. 124, 3369–3380, 10.1242/jcs.090852 (2011). - DOI - PubMed
    1. Dityatev A., Schachner M. & Sonderegger P. The dual role of the extracellular matrix in synaptic plasticity and homeostasis. Nat Rev Neurosci. 11, 735–746, 10.1038/nrn2898 (2010). - DOI - PubMed
    1. Slaker M. et al.. Removal of perineuronal nets in the medial prefrontal cortex impairs the acquisition and reconsolidation of a cocaine-induced conditioned place preference memory. J Neurosci. 35, 4190–4202, 10.1523/JNEUROSCI.3592-14.2015 (2015). - DOI - PMC - PubMed
    1. Conant K., Allen M. & Lim S. T. Activity dependent CAM cleavage and neurotransmission. Front Cell Neurosci. 9, 305, 10.3389/fncel.2015.00305 (2015). - DOI - PMC - PubMed

Publication types

MeSH terms