

Application of Targeted Mass Spectrometry for the Quantification of Sirtuins in the Central Nervous System
- PMID: 27762282
- PMCID: PMC5071856
- DOI: 10.1038/srep35391
Application of Targeted Mass Spectrometry for the Quantification of Sirtuins in the Central Nervous System
Abstract
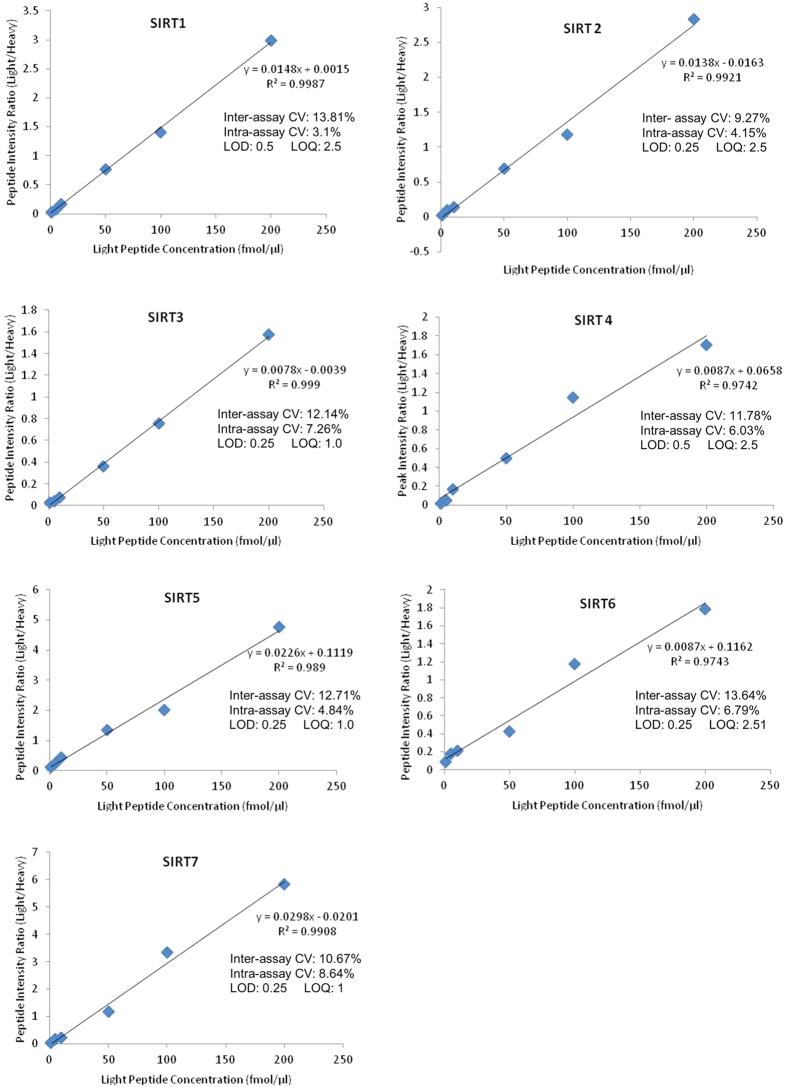
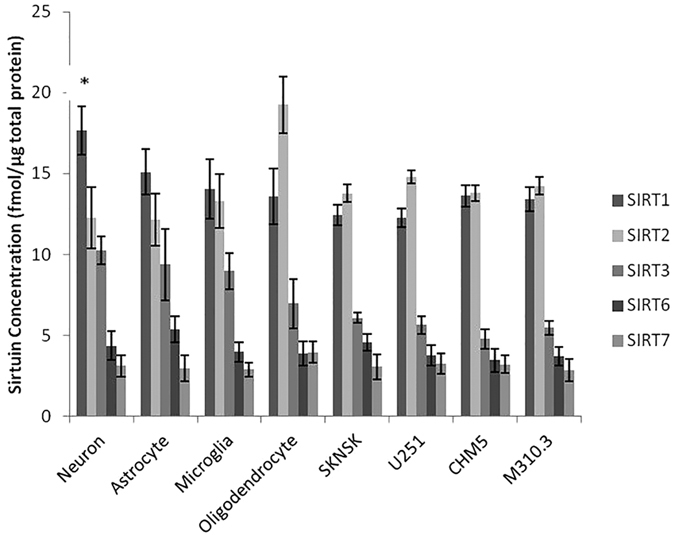
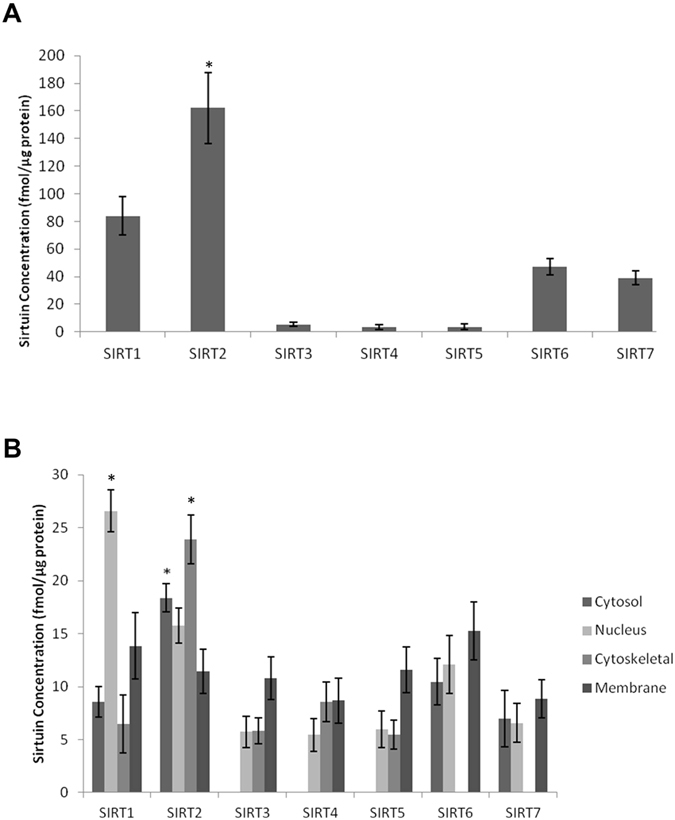
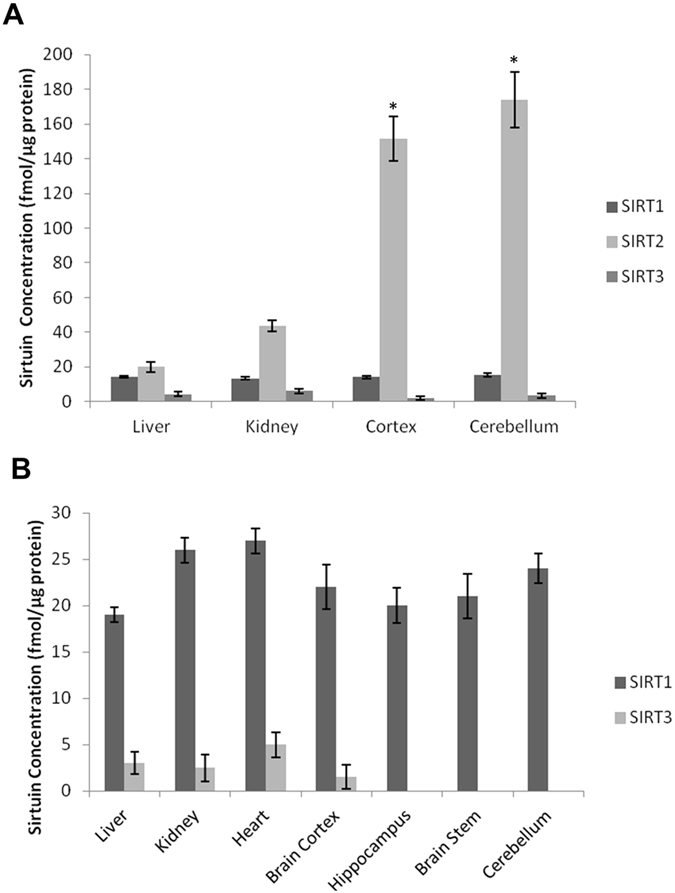
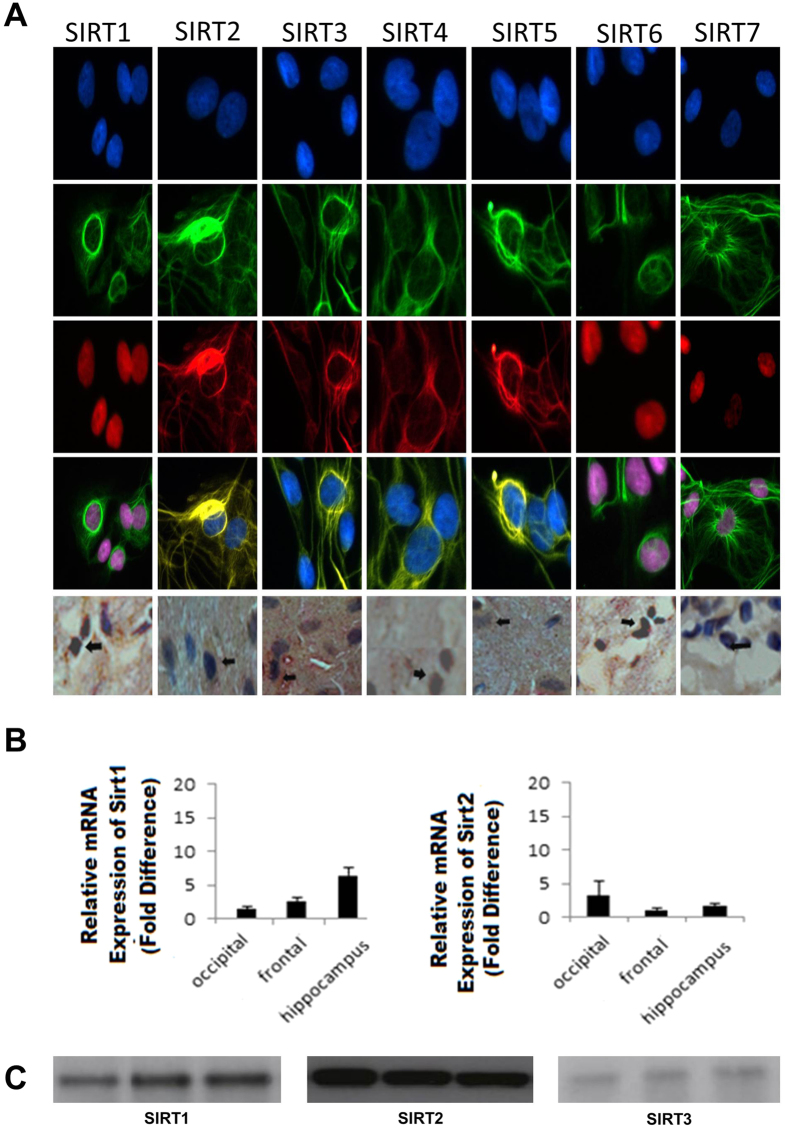
Sirtuin proteins have a variety of intracellular targets, thereby regulating multiple biological pathways including neurodegeneration. However, relatively little is currently known about the role or expression of the 7 mammalian sirtuins in the central nervous system. Western blotting, PCR and ELISA are the main techniques currently used to measure sirtuin levels. To achieve sufficient sensitivity and selectivity in a multiplex-format, a targeted mass spectrometric assay was developed and validated for the quantification of all seven mammalian sirtuins (SIRT1-7). Quantification of all peptides was by multiple reaction monitoring (MRM) using three mass transitions per protein-specific peptide, two specific peptides for each sirtuin and a stable isotope labelled internal standard. The assay was applied to a variety of samples including cultured brain cells, mammalian brain tissue, CSF and plasma. All sirtuin peptides were detected in the human brain, with SIRT2 being the most abundant. Sirtuins were also detected in human CSF and plasma, and guinea pig and mouse tissues. In conclusion, we have successfully applied MRM mass spectrometry for the detection and quantification of sirtuin proteins in the central nervous system, paving the way for more quantitative and functional studies.
Figures
Similar articles
-
Transcription levels of sirtuin family in neural stem cells and brain tissues of adult mice.Cell Mol Biol (Noisy-le-grand). 2012 Sep 10;Suppl.58:OL1737-43. Cell Mol Biol (Noisy-le-grand). 2012. PMID: 22992439
-
Expression/localization patterns of sirtuins (SIRT1, SIRT2, and SIRT7) during progression of cervical cancer and effects of sirtuin inhibitors on growth of cervical cancer cells.Tumour Biol. 2015 Aug;36(8):6159-71. doi: 10.1007/s13277-015-3300-y. Epub 2015 Mar 21. Tumour Biol. 2015. PMID: 25794641
-
Multiplexed Immunoaffinity Enrichment of Peptides with Anti-peptide Antibodies and Quantification by Stable Isotope Dilution Multiple Reaction Monitoring Mass Spectrometry.Methods Mol Biol. 2016;1410:135-67. doi: 10.1007/978-1-4939-3524-6_9. Methods Mol Biol. 2016. PMID: 26867743
-
A review of the sirtuin system, its clinical implications, and the potential role of dietary activators like resveratrol: part 1.Altern Med Rev. 2010 Sep;15(3):245-63. Altern Med Rev. 2010. PMID: 21155626 Review.
-
Sirtuin function in aging heart and vessels.J Mol Cell Cardiol. 2015 Jun;83:55-61. doi: 10.1016/j.yjmcc.2014.12.023. Epub 2015 Jan 9. J Mol Cell Cardiol. 2015. PMID: 25579854 Review.
Cited by
-
Personalized Medicine Approach to Proteomics and Metabolomics of Cytochrome P450 Enzymes: A Narrative Review.Eur J Drug Metab Pharmacokinet. 2024 Nov;49(6):661-676. doi: 10.1007/s13318-024-00912-5. Epub 2024 Sep 13. Eur J Drug Metab Pharmacokinet. 2024. PMID: 39269556 Review.
-
SIRT2 Inhibition Rescues Neurodegenerative Pathology but Increases Systemic Inflammation in a Transgenic Mouse Model of Alzheimer's Disease.J Neuroimmune Pharmacol. 2023 Sep;18(3):529-550. doi: 10.1007/s11481-023-10084-9. Epub 2023 Sep 12. J Neuroimmune Pharmacol. 2023. PMID: 37698780 Free PMC article.
-
Cerebellar Predominant Increase in mRNA Expression Levels of Sirt1 and Sirt3 Isoforms in a Transgenic Mouse Model of Huntington's Disease.Neurochem Res. 2020 Sep;45(9):2072-2081. doi: 10.1007/s11064-020-03069-0. Epub 2020 Jun 10. Neurochem Res. 2020. PMID: 32524313 Free PMC article.
-
Aged Breast Extracellular Matrix Drives Mammary Epithelial Cells to an Invasive and Cancer-Like Phenotype.Adv Sci (Weinh). 2021 Nov;8(22):e2100128. doi: 10.1002/advs.202100128. Epub 2021 Oct 7. Adv Sci (Weinh). 2021. PMID: 34617419 Free PMC article.
-
Characterisation of the periodontal proteome in gingival crevicular fluid and saliva using SWATH-MS.Front Cell Infect Microbiol. 2025 May 2;15:1576906. doi: 10.3389/fcimb.2025.1576906. eCollection 2025. Front Cell Infect Microbiol. 2025. PMID: 40384977 Free PMC article.
References
-
- Gueguen C., Palmier B., Plotkine M., Marchand-Leroux C. & Bessson V. C. Neurological and histological consequences induced by in vivo cerebral oxidative stress: evidence for beneficial effects of SRT1720, a sirtuin 1 activator, and sirtuin 1-mediated neuroprotective effects of poly(ADP-ribose) polymerase inhibition. PLoS One 9, e87367 (2014). - PMC - PubMed
-
- Alcendor R. R. et al.. Sirt1 regulates aging and resistance to oxidative stress in the heart. Circ Res 100, 1512–1521 (2007). - PubMed
-
- Wang F., Nguyen M., Qin F. X. & Tong Q. SIRT2 deacetylates FOXO3a in response to oxidative stress and caloric restriction. Aging Cell 6, 505–514 (2007). - PubMed
-
- Qiu X., Brown K., Hirschey M. D., Verdin E. & Chen D. Calorie restriction reduces oxidative stress by SIRT3-mediated SOD2 activation. Cell Metab 12, 662–667 (2010). - PubMed
Publication types
MeSH terms
Substances
LinkOut - more resources
Full Text Sources
Other Literature Sources
