. 2016 Oct 20:6:35673.
doi: 10.1038/srep35673.

Antigen-affinity controls pre-germinal center B cell selection by promoting Mcl-1 induction through BAFF receptor signaling

Affiliations

Antigen-affinity controls pre-germinal center B cell selection by promoting Mcl-1 induction through BAFF receptor signaling

Felix M Wensveen et al. Sci Rep. .

Erratum in

Abstract

Upon antigen encounter, the responsive B cell pool undergoes stringent selection which eliminates cells with low B cell receptor (BCR) affinity. Already before formation of the germinal center, activated B cells of low-affinity are negatively selected in a process that is molecularly not well understood. In this study, we investigated the mechanism behind pre-GC affinity-mediated B cell selection. We applied affinity mutants of HEL antigen and found that rapidly after activation B cells become highly dependent on the cytokine BAFF. Moreover, expression of BAFF receptor CD268 is regulated in a BCR-affinity dependent fashion. High affinity responses via BAFF correlated with PI3K activation, which controlled expression of the pro-survival protein Mcl-1, and thereby increased survival. In the presence of excess BAFF, or in absence of the Mcl-1 antagonist Noxa, more low-affinity B cells survived the first two days after antigen encounter. This resulted in increased numbers of antigen-specific B cells of low affinity upon immunization and reduced the overall affinity of cells that contributed to the germinal center reaction. Our findings elucidate a crucial molecular pathway of B cell selection in the earliest phases of activation by identifying a novel link between BCR affinity and BAFF-R signaling towards Mcl-1.


Figures
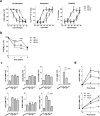
Figure 1
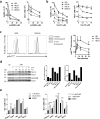
Figure 1. BCR affinity correlates with CD25 and BAFF-R induction.
(a) HELTG B cells were stimulated for 48 h with 100 ng/ml HEL, HEL2x or HEL3x in combination with 100 ng/ml BAFF. Proliferation, activation and viability were assessed by CFSE dilution, GL7 induction and PI negativity respectively using flow cytometry (n = 3). (b) HELTG B cells were stimulated with 100 ng/ml HEL, HEL2x or HEL3x in combination with 100 ng/ml BAFF. Viability was followed over time by determining the PI negative fraction (n = 3). (c) HELTG B cells were stimulated with 100 ng/ml HEL, HEL2x or HEL3x in combination with 100 ng/ml BAFF. After 48 h, cell surface expression of indicated molecules was analyzed by flow cytometry (n = 3). (d) HELTG B cells were stimulated with 100 ng/ml HEL, HEL2x or HEL3x in combination with 100 ng/ml BAFF. Cell surface expression of CD25 and BAFF-R was followed over time by flow cytometry (n = 3). *p < 0.05, **p < 0.01, ***p < 0.001 (ANOVA with Bonferroni’s post-testing). GMI = Geometric Mean Intensity.
Figure 2
Figure 2. BAFF but not IL-2 controls early activated B cell survival.
(a,b) HELTG B cells were stimulated with 100 ng/ml HEL, HEL2x or HEL3x in combination with (a) 10 ng/ml or 100 ng/ml of IL-2 or (b) with 50 ng/ml or 1000 ng/ml of BAFF and viability (PI) was analyzed after 48 h by flow cytometry (n = 3–4). (c) HELTG B cells were left untreated (Medium) or stimulated with 100 ng/ml HEL in the presence or absence of 100 ng/ml BAFF and viability (PI) was assessed after 48 h by flow cytometry. Shown is the fold increase in the percentage of viable cells after BAFF stimulation compared to cells cultured in absence of BAFF (n = 3). (d) HELTG B cells were stimulated with 100 ng/ml HEL, HEL2x or HEL3x and cultured on irradiated 3T3 cells transfected with a membrane-bound form of human BAFF (3TBAFF) or empty vector (3TEV). Viability (PI) was assessed after 48 h by flow cytometry (n = 3). (e) HELTG B cells were stimulated with 100 ng/ml HEL, HEL2x or HEL3x in combination with 100 ng/ml BAFF. BAFF-R mRNA levels were analyzed after 48 h by qPCR (n = 3). Values show means ± sem. Shown is relative induction of gene expression compared to Day 0. *P < 0.05, **P < 0.01, ***P < 0.001 (Student’s t-test and ANOVA with Bonferroni’s post-testing).
Figure 3
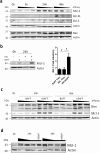
Figure 3. BAFF controls Mcl-1 protein levels in a BCR affinity-dependent manner.
(a) HELTG B cells were stimulated with 100 ng/ml HEL, HEL2x or HEL3x in the presence 100 ng/ml BAFF. (n = 8) (b) HELTG B cells were stimulated for 24 h with 100 ng/ml HEL, 100 ng/ml BAFF or both (n = 3) (c) HELTG B cells were stimulated with 100 ng/ml HEL, HEL2x or HEL3x in the presence or absence of 100 ng/ml BAFF (n = 3). Protein levels were quantified using densitometry and mean levels normalized for β-actin are shown in comparison to T = 0. (d) HELTG B cells were stimulated with 100 ng/ml HEL, HEL2x or HEL3x in the presence 100 ng/ml BAFF or with 100 ng/ml HEL3x in combination with 500 ng/ml BAFF (HiBaff). Total cell lysates were then probed by western blot for the indicated proteins. β-Actin was used as a loading control. Affinity ‘scale bars’ correspond with high (HEL), middle (HEL2x) or low (HEL3x) affinity ligands used for stimulation (n = 3). Values show means ± sem. *P < 0.05 (Student’s t-test and ANOVA with Bonferroni’s post-testing).
Figure 4
Figure 4. BCR affinity promotes BAFF induced PI3K signaling.
(a,b) HELTG B cells were left unactivated (Medium), or stimulated with 100 ng/ml BAFF alone (BAFF only) or in combination with 100 ng/ml HEL, HEL2x or HEL3x in the presence or absence of (a) the Pan-PI3K inhibitor Ly249002 or (b) the PI3Kδ inhibitor CAL-101. After 48 h viability and Mcl-1 protein levels were assessed by flow cytometry (n = 3). (c) HELTG B cells were stimulated with 100 ng/ml BAFF in combination with 100 ng/ml HEL, HEL2x or HEL3x. After 48 h, cells were deprived from stimuli for 3 h, followed by stimulation with 500 ng/ml BAFF. pAktT308 levels were measured by intracellular flow cytometry at the indicated time points (n = 3). (d) HELTG B cells were activated with the indicated stimuli. Mcl-1 and pGSK3β levels were determined by western blot. β-actin was used as a loading control. Quantification shows fold induction over the signal on day 0, normalized for β-actin. (e) HELTG B cells were left inactivated (Medium), or stimulated with 100 ng/ml BAFF alone (BAFF only) or in combination with 100 ng/ml HEL, HEL2x or HEL3x in the presence of solvent only (DMSO)or the GSK3 inhibitors XXVI or CHIR99021 (CHIR). All cells were cultured in the presence of 1 μM QVD to exclude caspase-mediated Mcl-1 breakdown. After 24 h Mcl-1 expression was assessed by flow cytometry (n = 3). Values show means ± sem. GMI = Geometric Mean Intensity *P < 0.05, **P < 0.01, ***P < 0.001 (ANOVA with Bonferroni’s post-testing).
Figure 5
Figure 5
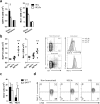
BCR affinity promotes BAFF-mediated Mcl-1 stabilization (a) 5 × 105 purified HELTG B cells (Ly5.2) were injected in WT (Ly5.1) recipients. After 24 h, recipients were immunized with HEL/Ova or HEL3x/Ova. After 48 h, Mcl-1 and BAFF-R expression were assessed in donor and recipient B cells (n = 3). (b) Mice were immunized with R-Phycoerythrin (PE) in alum. After 6 days, splenic B cells were stained with PE. Mcl-1 and BAFF-R expression was analyzed in resting (GL7Dim) B cells, or in high (PEBright) or low (PEDim) affinity Germinal Center (GL7BrightCD38Dim) B cells. Representative flow cytometry plots of cells gated for B220+ is shown (n = 5). (c,d) 5 × 105 purified CFSE-labeled HELTG B cells (Ly5.1/2) were injected in WT or BAFFTG (both Ly5.2) recipients. After 24 h, recipients were immunized i.p. with HEL/Ova or HEL3x/Ova. After 48 h, cells were analyzed (c) The number of donor cells was quantified in spleen (n = 3–5). (d) Representative flow cytometry plots of B cells transferred to WT recipients and left non-immunized or immunized with HEL3x/Ova (HEL3x) or HEL/Ova (HEL) GMI = Geometric Mean Intensity. Gated is for B220+CD45.1+CD45.2+ cells. Values show means ± sem. *P < 0.05, **P < 0.01 (Student’s t-test and ANOVA with Bonferroni’s post-testing).
Figure 6
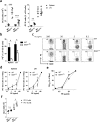
Figure 6. BAFF signaling limits survival after low-affinity triggering in vivo.
(a) WT and BAFFTG mice were immunized i.p. with TNP-KLH in alum. Relative and absolute Germinal Center (GC; B220+CD38DimGL7+) cell numbers were quantified in spleen and draining Lymph node after 12 days (n = 4–6). (b–f) WT and BAFFTG mice were immunized i.p. with PE in alum. After 12 days, mice were sacrificed and analyzed (n = 5). (b) The fraction of PE-binding B cells as a percentage of total GC B cells was determined by flow cytometry. (c) Germinal center B cells were stained in vitro with an increasing amount of PE and staining was visualized by flow cytometry. (d) quantification of data shown in c. PE-binding cells as a percentage of cells stained with 100 ng/ml PE (max.) is shown. (e) ELISA plates were coated with increasing amounts of PE. Antigen-binding IgG1 antibodies in serum were quantified. Values show means ± sem. (f) PE+ and PE B220+ B cells were analyzed for Mcl-1 expression by flow cytometry. *P < 0.05, **P < 0.01, ***P < 0.001 (Student’s t-test).
Figure 7
Figure 7. Noxa sets a survival threshold for high-affinity B cells.
(a,b) HELTG (WT) or Noxa−/−HELTG (Noxa−/−) B cells were stimulated with 100 ng/ml BAFF in combination with 100 ng/ml HEL or HEL2x. After 48 h Mcl-1 protein levels were determined by (a) western blot (β-actin was used as a loading control) and (b) Flow Cytometry. (c) HELTG (Ly5.1/2) and Noxa−/−HELTG (Ly5.2) B cells were mixed in a 1:1 ratio and 5 × 105 cells were injected in Ly5.1 WT recipients. After 24 h, recipients were immunized with HEL/Ova or HEL3x/Ova in alum. After 48 h donor cell ratios were determined in spleen and draining lymph node (n = 3–4). Dashed line indicates ratio between cells at time of injection. Values show means ± sem. *P < 0.05, ***P < 0.001 (Student’s t-test).

Similar articles

Cited by

References

    1. Shih T. A., Meffre E., Roederer M. & Nussenzweig M. C. Role of BCR affinity in T cell dependent antibody responses in vivo. Nat Immunol 3, 570–575, doi: 10.1038/ni803 (2002). - DOI - PubMed
    1. Dal Porto J. M., Haberman A. M., Kelsoe G. & Shlomchik M. J. Very low affinity B cells form germinal centers, become memory B cells, and participate in secondary immune responses when higher affinity competition is reduced. J Exp Med 195, 1215–1221 (2002). - PMC - PubMed
    1. De Silva N. S. & Klein U. Dynamics of B cells in germinal centres. Nat Rev Immunol 15, 137–148, doi: 10.1038/nri3804 (2015). - DOI - PMC - PubMed
    1. Chan T. D. et al. Antigen affinity controls rapid T-dependent antibody production by driving the expansion rather than the differentiation or extrafollicular migration of early plasmablasts. J Immunol 183, 3139–3149, doi: 10.4049/jimmunol.0901690 (2009). - DOI - PubMed
    1. Wensveen F. M., van Gisbergen K. P. & Eldering E. The fourth dimension in immunological space: how the struggle for nutrients selects high-affinity lymphocytes. Immunol Rev 249, 84–103, doi: 10.1111/j.1600-065X.2012.01156.x (2012). - DOI - PubMed

Publication types

MeSH terms

LinkOut - more resources