. 2016 Oct 20:6:35660.
doi: 10.1038/srep35660.

AKT/GSK3β signaling pathway is critically involved in human pluripotent stem cell survival

Affiliations

AKT/GSK3β signaling pathway is critically involved in human pluripotent stem cell survival

Leonardo Romorini et al. Sci Rep. .

Abstract

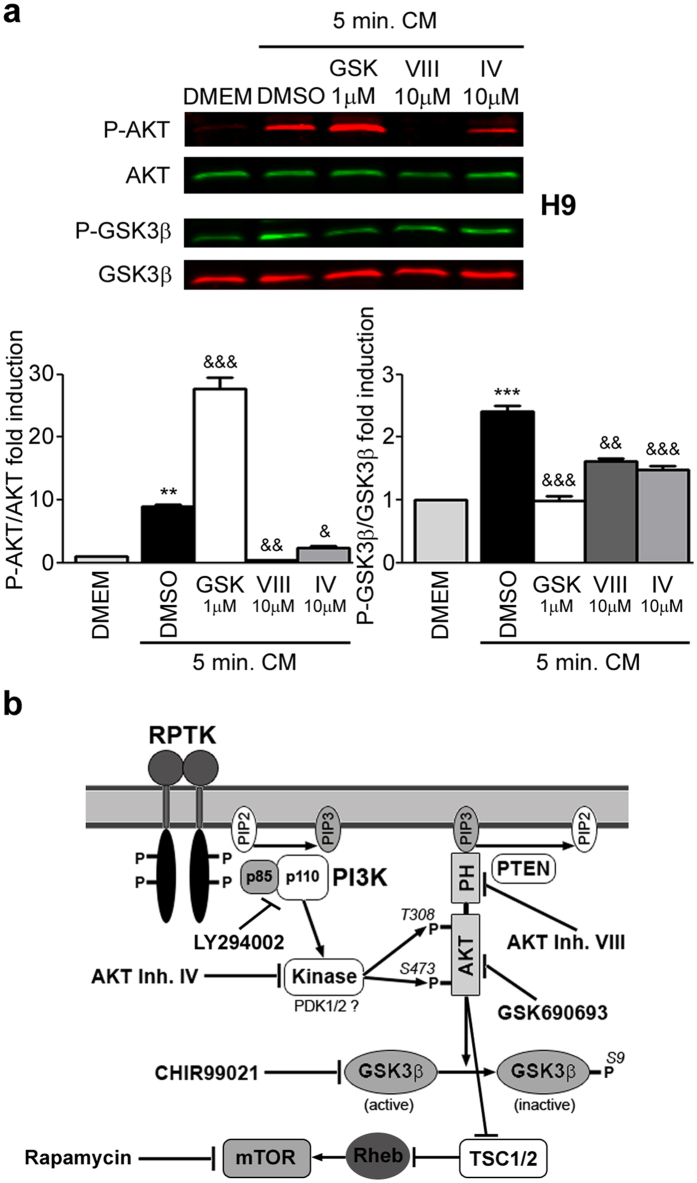
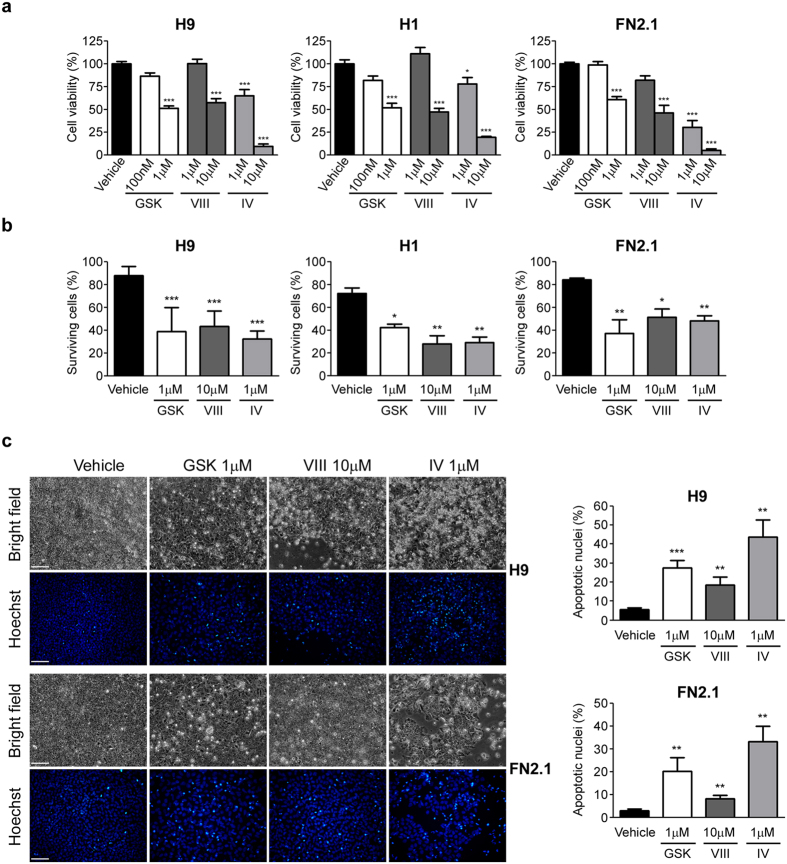
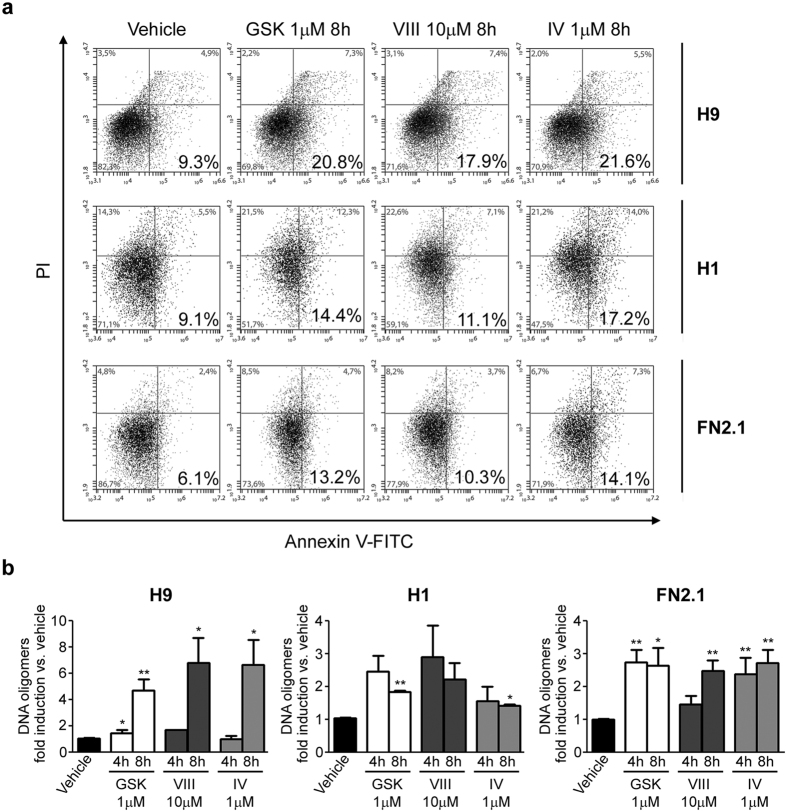
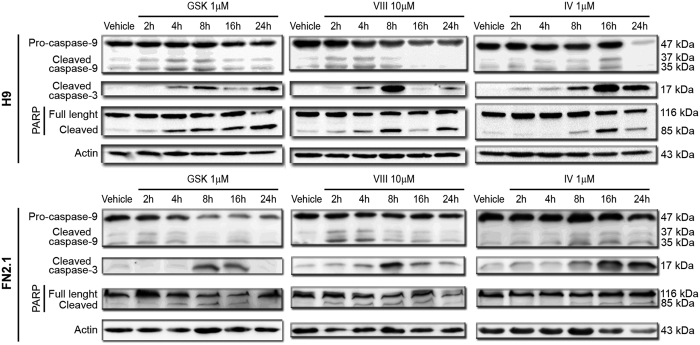
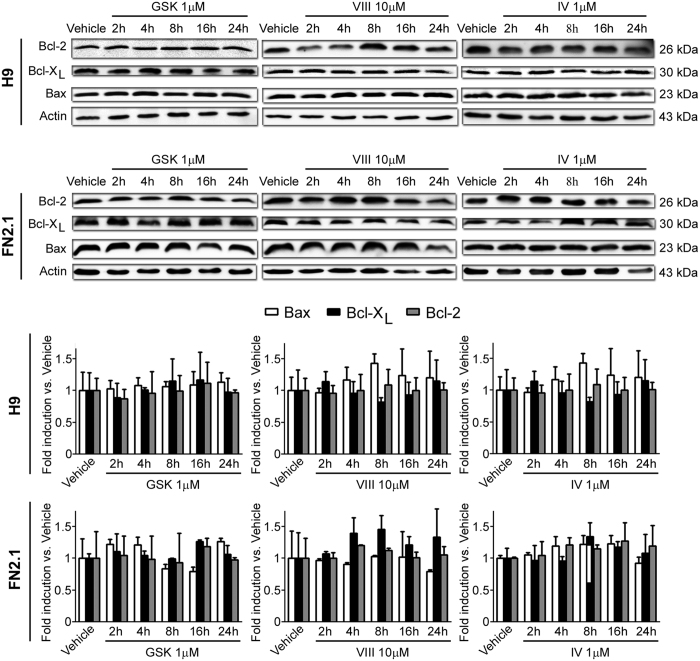
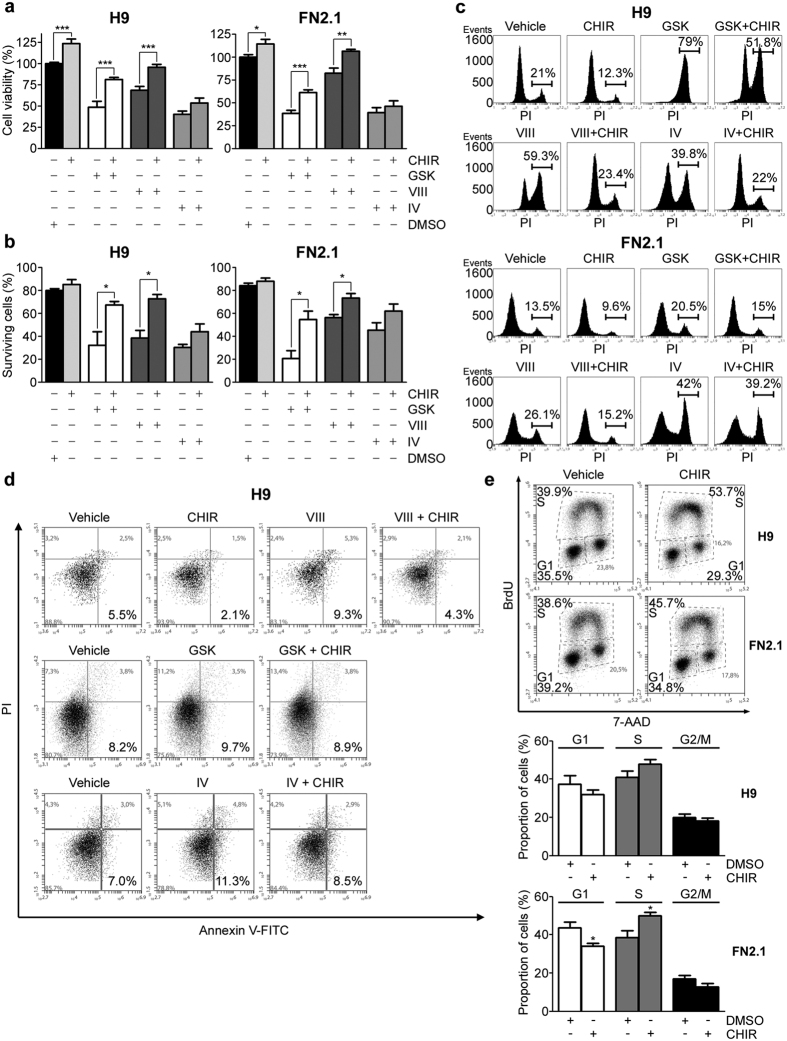
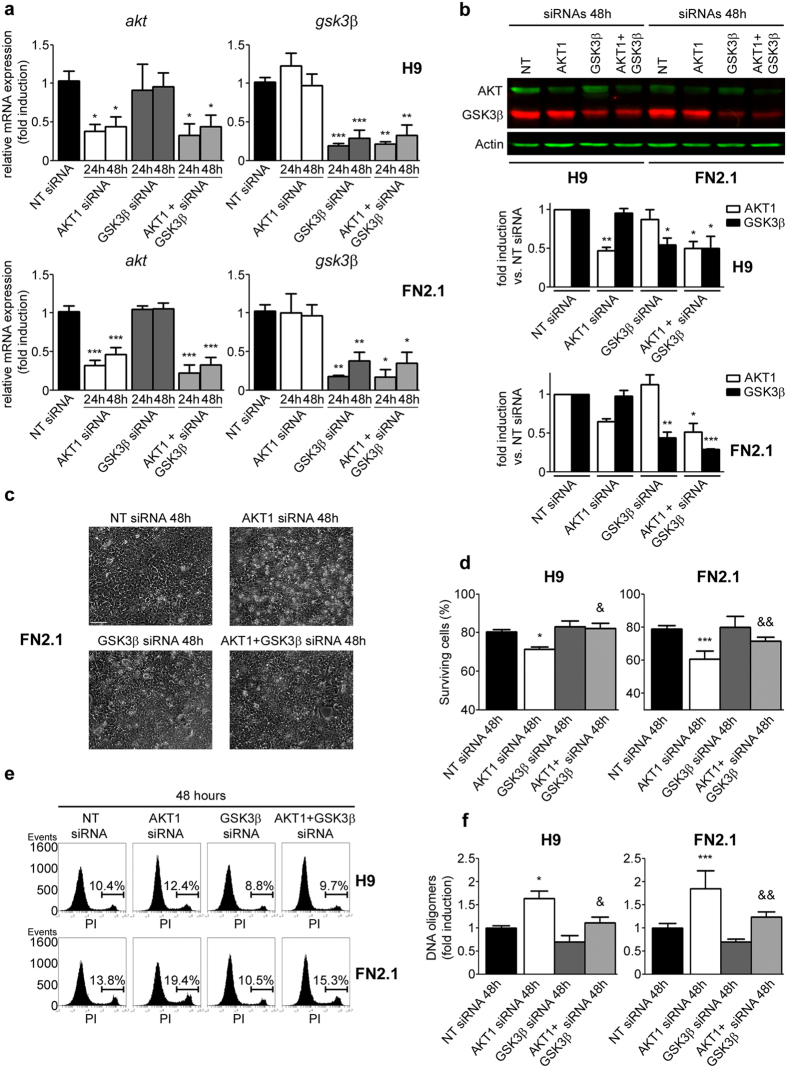
Human embryonic and induced pluripotent stem cells are self-renewing pluripotent stem cells (PSC) that can differentiate into a wide range of specialized cells. Basic fibroblast growth factor is essential for PSC survival, stemness and self-renewal. PI3K/AKT pathway regulates cell viability and apoptosis in many cell types. Although it has been demonstrated that PI3K/AKT activation by bFGF is relevant for PSC stemness maintenance its role on PSC survival remains elusive. In this study we explored the molecular mechanisms involved in the regulation of PSC survival by AKT. We found that inhibition of AKT with three non-structurally related inhibitors (GSK690693, AKT inhibitor VIII and AKT inhibitor IV) decreased cell viability and induced apoptosis. We observed a rapid increase in phosphatidylserine translocation and in the extent of DNA fragmentation after inhibitors addition. Moreover, abrogation of AKT activity led to Caspase-9, Caspase-3, and PARP cleavage. Importantly, we demonstrated by pharmacological inhibition and siRNA knockdown that GSK3β signaling is responsible, at least in part, of the apoptosis triggered by AKT inhibition. Moreover, GSK3β inhibition decreases basal apoptosis rate and promotes PSC proliferation. In conclusion, we demonstrated that AKT activation prevents apoptosis, partly through inhibition of GSK3β, and thus results relevant for PSC survival.


Figures

Figure 1
Figure 1. AKT phosphorylation and activity status.
(a) H9 hESCs grown on Matrigel were starved for 6 hours with KSR/bFGF-free DMEM/F12 cell culture medium and then changed for 5 minutes to complete iMEFs conditioned medium (CM) supplemented with 8 ng/ml bFGF plus DMSO (Vehicle) or any AKT inhibitor [GSKi (GSK, 1 μM), AKTi VIII (VIII, 10 μM) and AKTi IV (IV, 10 μM)]. After the starvation/stimulation period, p-AKT (Ser473), AKT, p-GSK3β (Ser9) (p-AKT substrate) and GSK3β expression levels were analyzed and quantified by Western blots with IR fluorescence secondary antibodies and Odyssey Imagers in order to test inhibitors efficacy in human pluripotent stem cells. The bars represent the level of p-AKT/AKT and p-GSK3β/GSK3β fold induction relative to untreated starved cells. The mean + SEM from three independent experiments are shown. Statistical analysis was performed by one-way ANOVAs followed by Tukey’s multiple comparisons test, **p < 0.01 and ***p < 0.001 vs. DMEM; &p < 0.05; &&p < 0.01 and &&&p< 0.001 vs. DMSO. (b) Schematic drawing of the PI3K/AKT/GSK3β and mTOR signaling pathway. PI3K is activated through receptor-binding tyrosine kinases (RPTK) by growth factors (as bFGF) resulting in phosphorylation of PIP2. PIP3 subsequently acts as a second messenger allowing the binding of Pleckstrin homology (PH) domain-containing proteins like AKT. Thereby the latter undergoes conformational changes leading to its phosphorylation and activation by PDK1/2. Termination of the signaling cascade can either occur through the dephosphorylation of PIP3 or AKT by PTEN or PP2A phosphatases, respectively. AKT participates in the regulation of cellular processes like cell growth and apoptosis by phosphorylating further proteins, such as GSK3β or TSC1/2 (which leads to mTOR activation). The target sites on the PI3K/AKT/GSK3β and mTOR signaling pathway of each of the inhibitors tested (GSK3β inhibitor CHIR99021; mTOR inhibitor Rapamycin; PI3K inhibitor LY294002; AKT specific inhibitors VIII, IV and GSK690693) is shown.
Figure 2
Figure 2. hESCs and hiPSCs cell viability upon AKT inhibitors treatment.
(a) H9, H1 hESCs and FN2.1 hiPSCs cell viability was analyzed 24 hours post-treatment with increasing concentrations of AKTi IV (IV), AKTi VIII (VIII) and GSKi (GSK) by XTT colorimetric assay. Vehicle = DMSO. Mean + SEM from three independent experiments are shown. Statistical analysis was done by one-way ANOVAs followed by Tukey’s multiple comparisons test, *p < 0.05 and ***p < 0.001 vs. Vehicle. (b) Histogram shows percentage of surviving cells assessed by Trypan blue exclusion method 24 hours after incubation with AKT inhibitors [AKTi IV (IV, 1 μM), AKTi VIII (VIII, 10 μM) and GSKi (GSK, 1 μM)]. Mean + SEM from at least three independent experiments are shown. Statistical analysis was done by one-way ANOVAs followed by Tukey’s multiple comparisons test, *p = <0.05; **p = <0.01 and ***p = <0.001 vs. Vehicle (DMSO). (c) Chromatin condensation was analyzed by Hoechst staining 24 hours after incubation of H9 and FN2.1 cells with AKT inhibitors [AKTi IV (IV, 1 μM), AKTi VIII (VIII, 10 μM) and GSKi (GSK, 1 μM)]. Figure shows representative images and means + SEM from three independent experiments are graphed for % of apoptotic nuclei. The scale bar represent 100 μm. Statistical analysis was done by Student’s t-test, **p = <0.01 and ***p = <0.001 vs. Vehicle (DMSO).
Figure 3
Figure 3. Annexin V translocation and DNA fragmentation upon AKT inhibition.
(a) Phosphatidylserine (PS) translocation from the inner to the outer leaflet of the plasma membrane was examined by Annexin V and propidium iodide (PI) double staining. A representative of three independent experiments biparametric flow cytometry analysis of combined fluorescein isothiocyanate (FITC)-conjugated Annexin V and PI staining distinguishing viable (PI, Annexin V bottom left), early apoptotic (PI, Annexin V+ bottom right), late apoptotic (PI+, Annexin V+; top right) and necrotic (PI+, Annexin V, top left) cells is shown for H9, H1 and FN2.1 after 8 hours of incubation with AKT inhibitors [AKTi IV (IV, 1 μM), AKTi VIII (VIII, 10 μM) and GSKi (GSK, 1 μM)]. Percentage of cells in each quadrant is shown. (b) Genomic DNA fragmentation into oligomers of 180–200 bp or multiples of that was quantified in H9, H1 and FN2.1 cells at 4 and 8 hours post-treatment with AKT inhibitors [AKTi IV (IV, 1 μM), AKTi VIII (VIII, 10 μM) and GSKi (GSK, 1 μM)] using a specific ELISA kit. Mean + SEM fold induction relative to Vehicle (DMSO) of three independent experiments are shown. Statistical analysis was done by Student’s t-test, *p = <0.05 and **p = <0.01 vs. Vehicle (DMSO).
Figure 4
Figure 4. Caspase-9, Caspase-3 activation and PARP cleavage upon AKT inhibitors incubation.
Cleavage and activation of initiator Caspase-9, effector Caspase-3 and PARP proteolysis (Caspase-3 substrate) were analyzed by Western blot in H9 and FN2.1 cells at 2, 4, 8, 16 and 24 hours post specific AKT inhibitors treatment [AKTi IV (IV, 1 μM), AKTi VIII (VIII, 10 μM) and GSKi (GSK, 1 μM)]. Actin was used as loading control. Representative blots of three independent experiments are shown.
Figure 5
Figure 5. BCL-2 family member expression levels.
Expression levels of BCL-2 family members, including BAX (pro-apoptotic), BCL-2 (anti-apoptotic) and BCL-XL (anti-apoptotic) were analyzed by Western blot in H9 and FN2.1 cells at 2, 4, 8, 16 and 24 hours post AKT inhibitors treatment [AKTi IV (IV, 1 μM), AKTi VIII (VIII, 10 μM) and GSKi (GSK, 1 μM)]. Actin was used as loading control. Mean + SEM fold induction relative to Vehicle (DMSO) and representative blots of three independent experiments are shown.
Figure 6
Figure 6. Involvement of GSK3β signaling in AKT regulation of hESCs and hiPSCs cell viability and apoptosis.
(a) H9 and FN2.1 cell viability was analyzed by XTT colorimetric assay at 24 hours post-treatment with AKT inhibitors IV (IV, 1 μM), VIII (VIII, 10 μM) and GSKi (GSK, 1 μM) in the presence or absence of CHIRi (CHIR, 3 μM). Mean + SEM from three independent experiments are shown. Statistical analysis was performed by Student’s t test, *p = <0.05; **p = <0.01 and ***p = <0.001 (b) Histogram shows quantitative percentage of surviving cells assessed by Trypan blue exclusion method 24 hours post-AKT inhibitors treatment [IV (1 μM), VIII (10 μM) and GSK (1 μM)] with or without CHIRi (CHIR, 3 μM). Mean + SEM from three independent experiments are shown. Student’s t test, *p = <0.05. (c) Representative histograms, of three independent experiments, of Propidium iodide (PI) staiStatistical analysis was donened H9 and FN2.1 unfixed cells treated for 24 hours with AKT inhibitors [IV (1 μM), VIII (10 μM) and GSK (1 μM)] in combination or not with CHIRi (CHIR, 3 μM). Percentage of PI positive cells (late apoptotic or necrotic) was determined by flow cytometric analysis. Vehicle: DMSO. (d) A representative biparametric flow cytometry analysis, of three independent experiments, of combined fluorescein isothiocyanate (FITC)-conjugated Annexin V and PI staining identifying viable (bottom left), early apoptotic (bottom right), late apoptotic (top right) and necrotic (top left) cells is shown for H9 cells at 8 hours post-AKT inhibitors treatment [IV (1 μM), VIII (10 μM) and GSK (1 μM)] in combination or not with CHIRi (CHIR, 3 μM). Vehicle: DMSO. Percentage of cells in each quadrant is shown. (e) Representative BrdU-APC/7-AAD flow cytometry cell cycle analysis of H9 and FN2.1 undifferentiated cells treated with CHIRi (CHIR, 3 μM) for 24 hours. Vehicle: DMSO. Means + SEM from three independent experiments are graphed for the proportion of cells (%) in each stage of cell cycle (G1, S and G2/M). Statistical analysis was performed by Student’s t-test, *p = <0.05 vs. Vehicle (DMSO).
Figure 7
Figure 7. Effect of siRNA-mediated down regulation of AKT1 and GSK3β in hESCs and hiPSCs cell viability and apoptosis.
H9 hESCs and FN2.1 hiPSCs grown until 85% confluence with E8 media in Vitronectin coated dishes were transfected with negative control no-targeting siRNA (NT siRNA) (10 nM) or AKT1 siRNA (10 nM) or GSK3β siRNA (10 nM) or AKT1 + GSK3β siRNAs (10 nM) and then: (a) mRNA expression levels of akt and gsk3β were analyzed by Real Time RT-PCR at 24 and 48 hours post siRNAs transfection. rpl7 expression was used as normalizer. Graph shows mean + SEM mRNA fold induction relative to NT siRNA transfectants arbitrarily set as 1 from three independent experiments. (b) Expression levels of AKT and GSK3β were analyzed by Western blot in H9 and FN2.1 cells at 48 hours post siRNAs transfection. Actin was used as loading control. Mean + SEM fold induction relative to the corresponding NT siRNA and representative blots of three independent experiments are shown. (c) Representative images of FN2.1 cells at 48 hours post siRNAs transfection are shown. The scale bars represent 100 μm. (d) Histograms show percentage of surviving cells assessed by Trypan blue exclusion method 48 hours post siRNAs transfection. Mean + SEM from five independent experiments are shown. (e) Representative histograms, of three independent experiments, of Propidium iodide (PI) stained H9 and FN2.1 unfixed cells at 48 hours post siRNA transfection. Percentage of PI positive cells (late apoptotic or necrotic) was determined by flow cytometric analysis. (f) Genomic DNA fragmentation into oligomers of 180–200 bp or multiples of that was quantified in H9 and FN2.1 cells at 48 hours post siRNAs transfection using a specific ELISA kit. Mean + SEM fold induction relative to NT siRNA of four independent experiments are shown. (a,b,d,f) Statistical analysis was done by one-way ANOVAs followed by Tukey’s multiple comparisons test, ***p <0.001; **p <0.01 and *p <0.05 vs. NT siRNA; &&p < 0.01 and &p < 0.05 vs. AKT1 siRNA.

Similar articles

Cited by

References

    1. Thomson J. A. et al.. Embryonic stem cell lines derived from human blastocysts. Science 282, 1145–1147 (1998). - PubMed
    1. Takahashi K. et al.. Induction of pluripotent stem cells from adult human fibroblasts by defined factors. Cell 131, 861–872 (2007). - PubMed
    1. Bottcher R. T. & Niehrs C. Fibroblast growth factor signaling during early vertebrate development. Endocr. Rev. 26, 63–77 (2005). - PubMed
    1. Dvorak P. et al.. Expression and potential role of fibroblast growth factor 2 and its receptors in human embryonic stem cells. Stem Cells 23, 1200–1211 (2005). - PubMed
    1. Carvajal-Vergara X. et al.. Patient-specific induced pluripotent stem-cell-derived models of LEOPARD syndrome. Nature 465, 808–812 (2010). - PMC - PubMed

Publication types

Substances

LinkOut - more resources