. 2016 Oct 20:6:35848.
doi: 10.1038/srep35848.

Exploiting the neoantigen landscape for immunotherapy of pancreatic ductal adenocarcinoma

Affiliations

Exploiting the neoantigen landscape for immunotherapy of pancreatic ductal adenocarcinoma

Peter Bailey et al. Sci Rep. .

Abstract

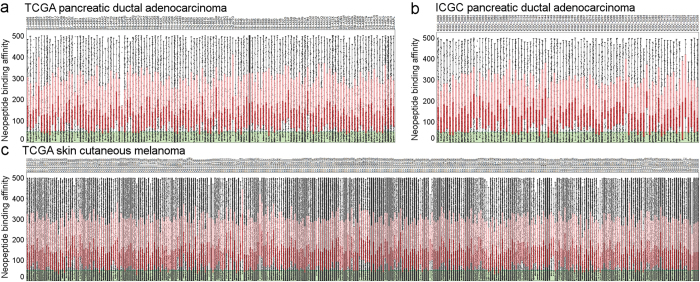
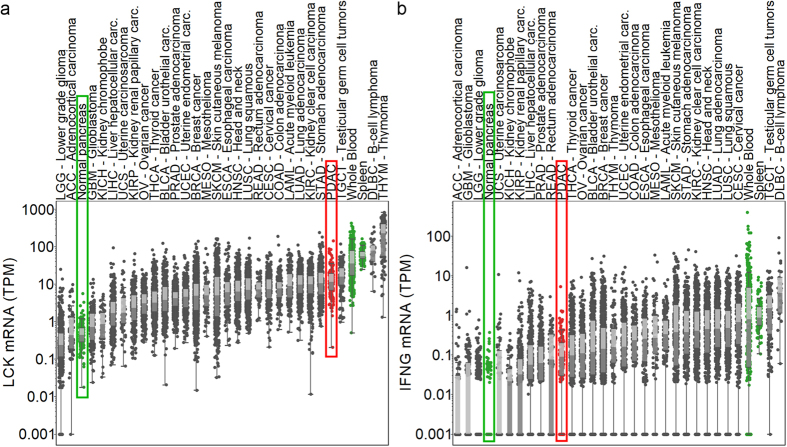
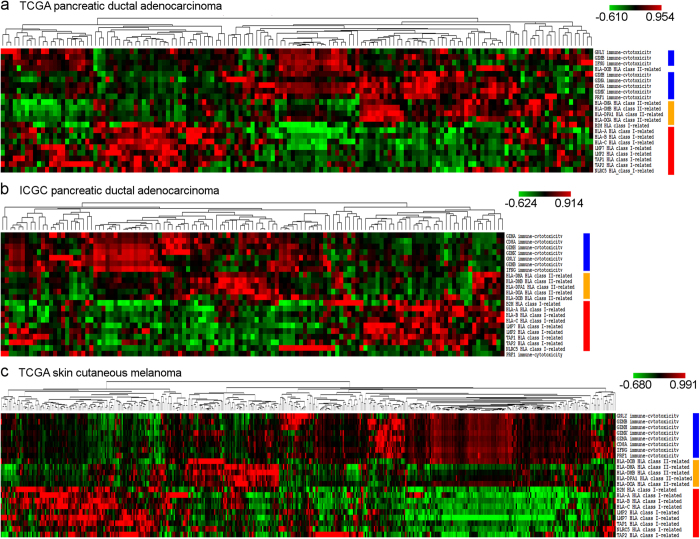
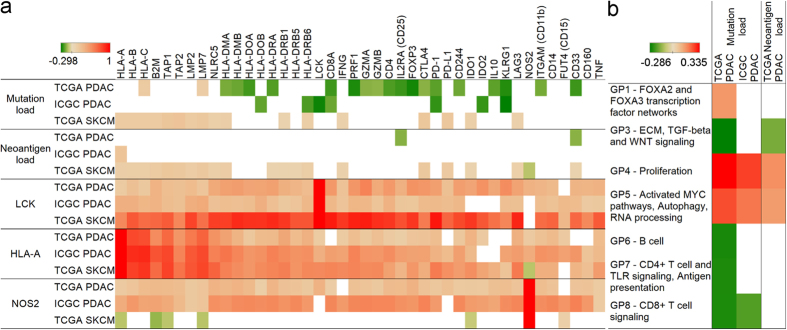
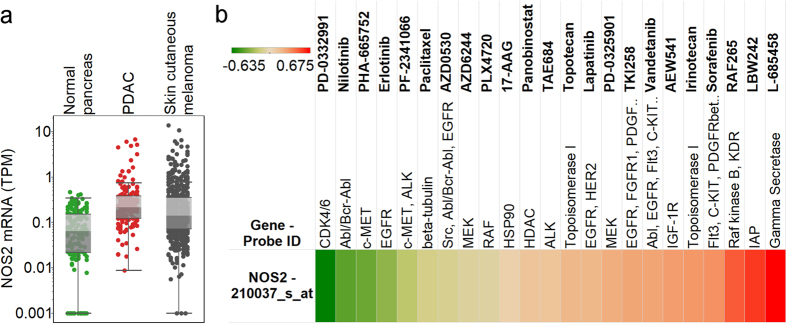
Immunotherapy approaches for pancreatic ductal adenocarcinoma (PDAC) have met with limited success. It has been postulated that a low mutation load may lead to a paucity of T cells within the tumor microenvironment (TME). However, it is also possible that while neoantigens are present, an effective immune response cannot be generated due to an immune suppressive TME. To discern whether targetable neoantigens exist in PDAC, we performed a comprehensive study using genomic profiles of 221 PDAC cases extracted from public databases. Our findings reveal that: (a) nearly all PDAC samples harbor potentially targetable neoantigens; (b) T cells are present but generally show a reduced activation signature; and (c) markers of efficient antigen presentation are associated with a reduced signature of markers characterizing cytotoxic T cells. These findings suggest that despite the presence of tumor specific neoepitopes, T cell activation is actively suppressed in PDAC. Further, we identify iNOS as a potential mediator of immune suppression that might be actionable using pharmacological avenues.


Figures

Figure 1
Figure 1. The neoantigen landscape of pancreatic ductal adenocarcinoma and skin cutaneous melanoma.
Binding affinity of neopeptides is shown for PDAC samples in the TCGA (a) and ICGC (b) projects for affinity <500 nM neopeptides. Strong binder (<50 nM) neopeptides are highlighted with green color. TCGA skin cutaneous melanoma neopeptides are presented similary (c). Red boxes represent the quartile below the median neopeptide binding affinity, while pink boxes highlight quartiles above the median binding affinity.
Figure 2
Figure 2. T cells are present but inactive in PDAC.
Expression levels of LCK T-cell marker (a) and interferon gamma which plays a central role in immune system function (b) are shown on the y axis for 30 tumor tissue types (grey, red: pancreatic cancer) and normal tissues (normal pancreas, spleen, whole blood). Dark and light grey boxes represent the two quartiles around the median expression.
Figure 3
Figure 3. Gene expressions related to antigen presentation and cytotoxic activity are negatively correlated.
Antigen presentation (red bar: class I-related - HLA-A, HLA-B, HLA-C, B2M, TAP1, TAP2, NLRC5, LMP2, and LMP7, orange bar: class II-related - HLA-DMA, HLA-DMB, HLA-DOA, HLA-DOB, and HLA-DPA1) and immune cytotoxicity gene expression (blue bar, CD8A, GNLY, GZMA, GZMB, GZMH, GZMK, IFNG, and PRF1) clustering shows two dominant cluster pairs in the TCGA (a) and ICGC (b) PDAC data sets, and also in SKCM (c). Low class I and/or class II antigen presentation (green in heat map) is associated with high (red in heat map) expression of cytotoxicity markers, while high antigen presentation correlates with low cytotoxic activity.
Figure 4
Figure 4. Mutation load in PDAC negatively correlates with T-cell activity.
Spearman’s rank correlation coefficients showing how mutation load (first row), neoantigen load (second row), and LCK, HLA-A, and NOS2 (rows 3–5) correlate with gene expressions related to class I and II antigen presentation, cytotoxic activity, immune checkpoints, Treg, and MDSC cells (panel a). Gene program scores related to proliferation, activated MYC pathways, autophagy, and RNA processing show positive, while B cell, CD4+ T cell and TLR signaling, antigen presentation, and CD8+ T cell signaling show negative correlations (panel b). Only p < 0.1 correlations are shown.
Figure 5
Figure 5. Expression and drug response associations of NOS2/iNOS.
Gene expressions are shown on the y axis for normal pancreas, PDAC, and skin cutaneous melanoma (a). PDAC expression is significantly higher compared to normal pancreas (p < 0.0001). Pearson’s correlation coefficients of NOS2 gene expression and drug EC50 values (b) are presented as indicated by the color scale (green: negative, red: positive correlation).

References

    1. Siegel R. L., Miller K. D. & Jemal A. Cancer statistics, 2015. CA: a cancer journal for clinicians 65, 5–29 (2015). - PubMed
    1. Hidalgo M. Pancreatic cancer. The New England journal of medicine 362, 1605–1617 (2010). - PubMed
    1. Valsecchi M. E., Diaz-Canton E., de la Vega M. & Littman S. J. Recent treatment advances and novel therapies in pancreas cancer: a review. Journal of gastrointestinal cancer 45, 190–201 (2014). - PMC - PubMed
    1. Cancer Genome. Atlas N. Genomic Classification of Cutaneous Melanoma. Cell 161, 1681–1696 (2015). - PMC - PubMed
    1. Le D. T. et al.. PD-1 Blockade in Tumors with Mismatch-Repair Deficiency. The New England journal of medicine 372, 2509–2520 (2015). - PMC - PubMed

Publication types

MeSH terms

Substances