. 2016 Oct 18;17(10):1741.
doi: 10.3390/ijms17101741.

Structural Interface Forms and Their Involvement in Stabilization of Multidomain Proteins or Protein Complexes

Affiliations

Structural Interface Forms and Their Involvement in Stabilization of Multidomain Proteins or Protein Complexes

Jacek Dygut et al. Int J Mol Sci. .

Abstract

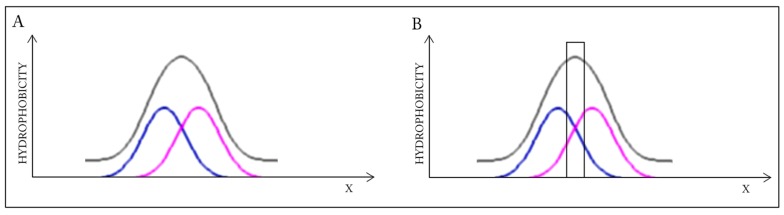
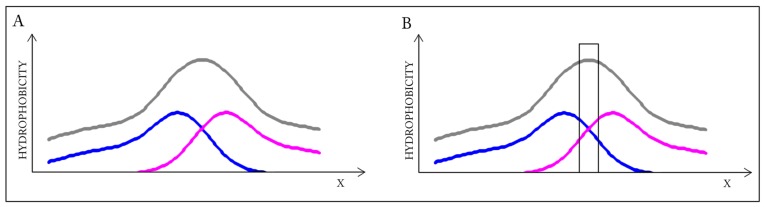
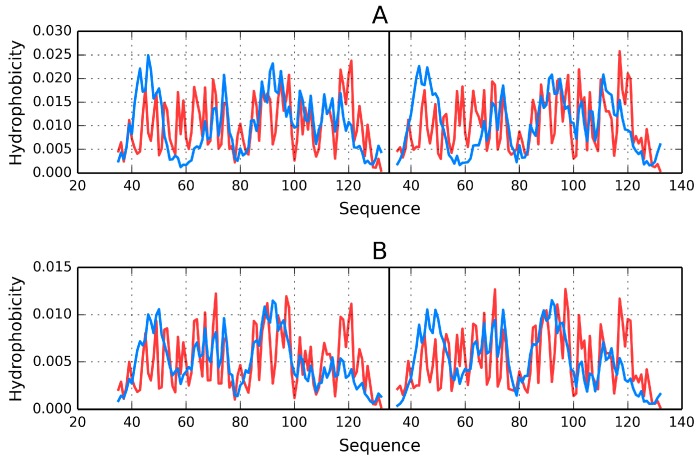
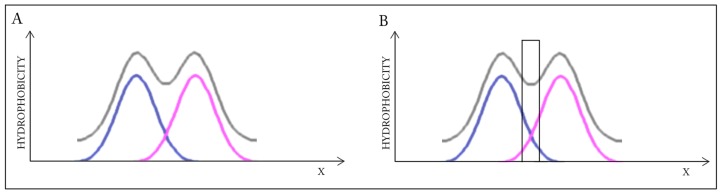
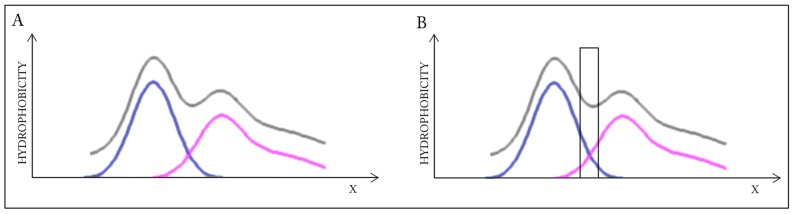
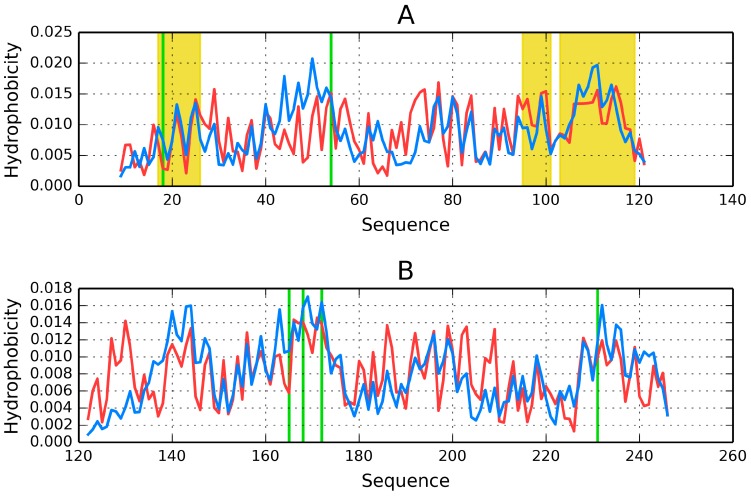
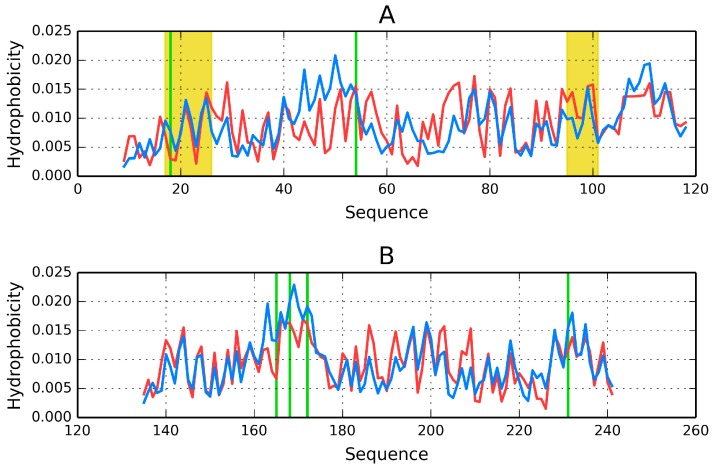
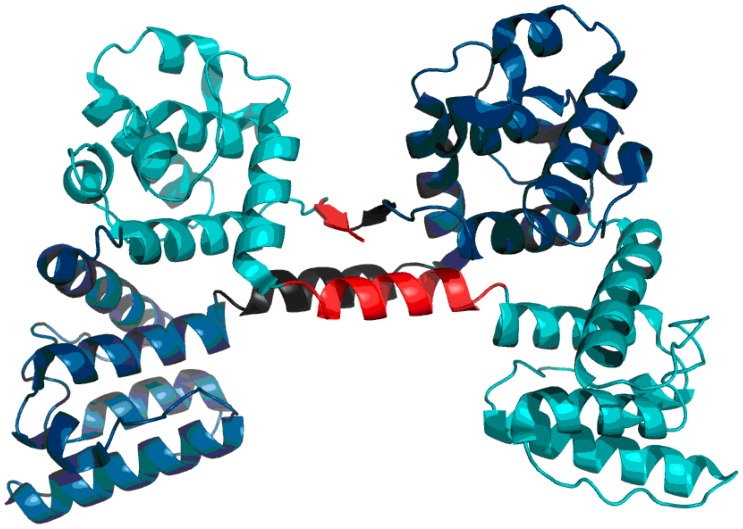
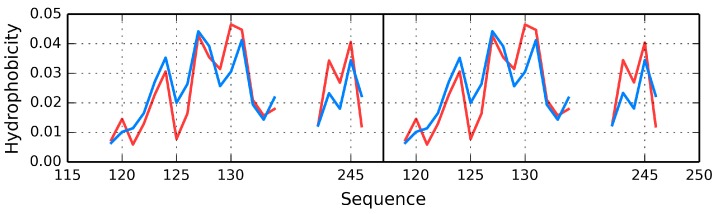
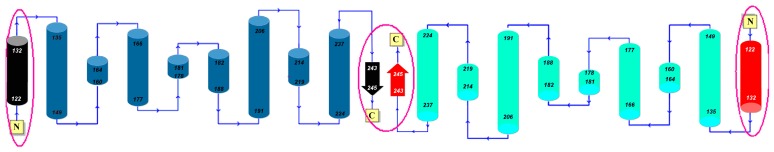
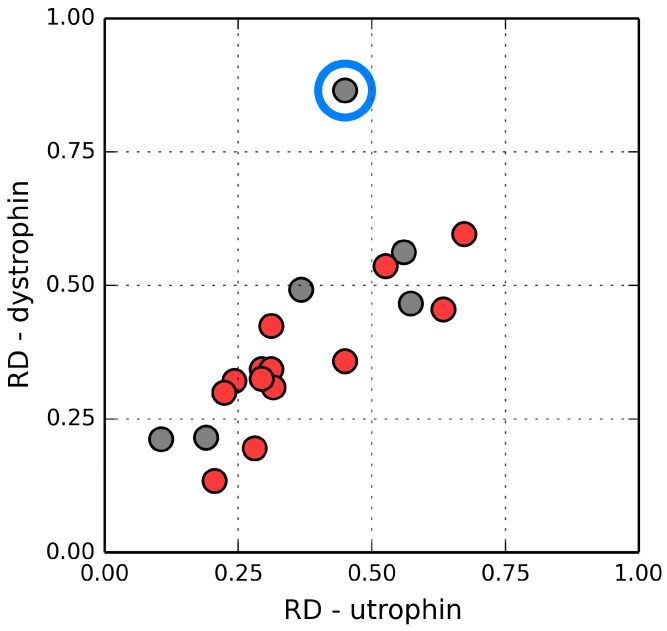
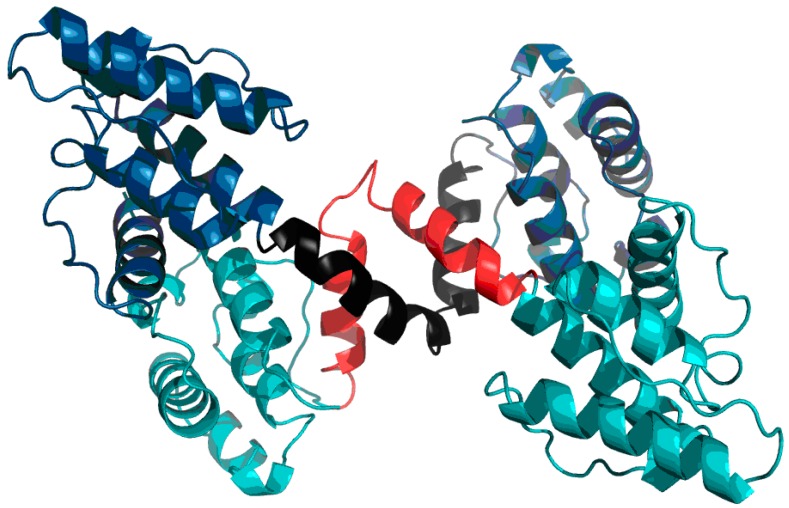
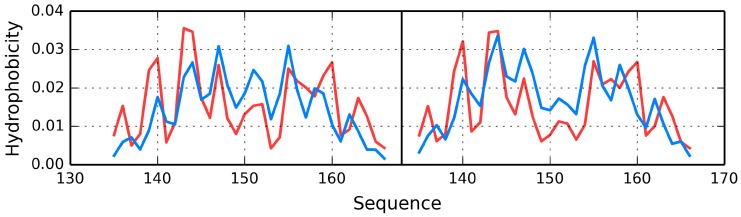
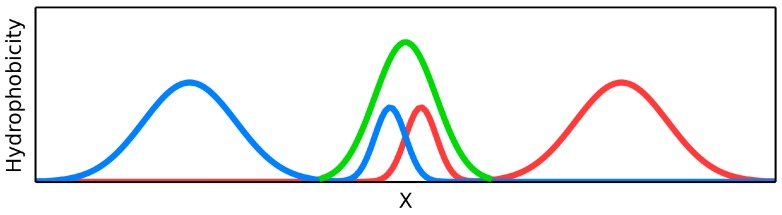
The presented analysis concerns the inter-domain and inter-protein interface in protein complexes. We propose extending the traditional understanding of the protein domain as a function of local compactness with an additional criterion which refers to the presence of a well-defined hydrophobic core. Interface areas in selected homodimers vary with respect to their contribution to share as well as individual (domain-specific) hydrophobic cores. The basic definition of a protein domain, i.e., a structural unit characterized by tighter packing than its immediate environment, is extended in order to acknowledge the role of a structured hydrophobic core, which includes the interface area. The hydrophobic properties of interfaces vary depending on the status of interacting domains-In this context we can distinguish: (1) Shared hydrophobic cores (spanning the whole dimer); (2) Individual hydrophobic cores present in each monomer irrespective of whether the dimer contains a shared core. Analysis of interfaces in dystrophin and utrophin indicates the presence of an additional quasi-domain with a prominent hydrophobic core, consisting of fragments contributed by both monomers. In addition, we have also attempted to determine the relationship between the type of interface (as categorized above) and the biological function of each complex. This analysis is entirely based on the fuzzy oil drop model.

Keywords: domain; dystrophin; homodimers; hydrophobic core; hydrophobicity; interface; utrophin.


Conflict of interest statement

Authors declare no conflict of interest.

Figures

Figure 1
Figure 1
Schematic depiction of a system in which the dimer as well as its individual monomers contain well-defined hydrophobic cores. Elimination (black bar on the right profile) of residues involved in complexation distorts the dimeric core. Blue and pink lines: distributions in monomers, gray line: distribution in dimer. (A) Status of the individual monomers (blue and pink) versus the resultant distribution in dimer (gray); (B) The removal of the interface (black bar) does not change the status of the dimer—Distribution accordant versus the expected one.
Figure 2
Figure 2
Schematic depiction of a system in which individual monomers lack hydrophobic cores but the dimer as a whole contains a well-defined core. Elimination of residues involved in complexation distorts the dimeric core while bolstering the monomeric cores—The black frame (right-hand schema) symbolizes the interface, which has been eliminated from RD calculation to characterize its influence on the status of the dimer, as well as the status of each monomer. Blue and pink lines: distributions in monomers, gray line: distribution in dimer. (A) Status of the individual monomers (blue and pink) versus the resultant distribution in dimer (gray); (B) the removal of the interface (black bar) does not change the status of the dimer—Distribution accordant versus the expected one.
Figure 3
Figure 3
Hydrophobicity density distributions (theoretical: blue line; observed: red line) in 1Y7Q. (A) Monomer chain A and B respectively; (B) chain A and B in dimmer (common ellipsoid for both chains).
Figure 4
Figure 4
Schematic depiction of a system in which the dimer lacks a clear hydrophobic core while each monomer retains a well-defined core. Elimination of residues involved in complexation (right-hand image) leads to better accordance with the model when considering the dimer as a whole. Blue and pink lines: distributions in monomers, gray line: distribution in dimer. (A) Status of the individual monomers (blue and pink) versus the resultant distribution in dimer (gray); (B) Removal of the interface (black bar) changes the status of the dimer—Distribution appears accordant versus the expected one.
Figure 5
Figure 5
Schematic depiction of a system in which only one monomer contains a prominent hydrophobic core. Elimination of residues involved in complexation (right-hand image) leads to better accordance with the model when considering the dimer as a whole. Blue and pink lines: distributions in monomers, gray line: distribution in dimer. (A) Status of the individual monomers (blue and pink) versus the resultant distribution in dimer (gray); (B) The removal of the interface (black bar) does not change the status of the dimer—Distribution still discordant versus the expected one.
Figure 6
Figure 6
Theoretical (blue line) and observed (red line) hydrophobicity density distribution profiles in dystrophin: A—CH1 (complete domain), B—CH2 (complete domain). Green lines: positions of disease-related mutations, yellow area: fragment interacting with actin.
Figure 7
Figure 7
Theoretical (blue line) and observed (red line) hydrophobicity density distribution profiles. (A) CH1 (modified domain); (B) CH2 (modified domain). Green lines: positions of disease-related mutations. Yellow area: fragment interacting with actin.
Figure 8
Figure 8
Structure of dystrophin: chain A (turquoise) with two fragments of the B chain (dark blue). The red fragments of the A chain interact with the corresponding black fragments of the B chain to produce the FOD domain.
Figure 9
Figure 9
Hydrophobicity profile for the interface-domain in dystrophin comprising fragments of the A chain (left) (119–134 and 242–246) and analogous fragments of the B chain (right). Blue line: expected distribution; red line: observed distribution. The chart reveals good accordance between both profiles. Residues 119–134 form helixes, while residues 242–246 form β-folds.
Figure 10
Figure 10
FOD domain structure distinguished by red ellipses. The color patter is identical to the one used in Figure 8.
Figure 11
Figure 11
Relation between the status of individual secondary folds in dystrophin and in utrophin. The blue circle marks an outlier which corresponds to an exposed loop. Red: helices, gray: loops.
Figure 12
Figure 12
Utrophin homodimer (chain A: Dark blue; chain B: Teal). Fragments contributed to the domain interface by chains A and B are marked in black and red respectively.
Figure 13
Figure 13
Utrophin-Theoretical (blue line) and observed (red line) hydrophobicity density profiles. The similarity between both distributions is evident.
Figure 14
Figure 14
Schematic representation of the interface-domain formed by both chains in the interface area. Blue and red lines: ndividual chains, Green line: the additional domains generated by fragments of individual chains.

Similar articles

Cited by

References

    1. Levinthal C. Are there pathways for protein folding? J. Chem. Phys. 1968;65:44–45.
    1. Dill K.A. Polymer principles and protein folding. Protein Sci. 1999;8:1166–1180. doi: 10.1110/ps.8.6.1166. - DOI - PMC - PubMed
    1. Leopold P.E., Montal M., Onuchic J.N. Protein folding funnels: A kinetic approach to the sequence-structure relationship. Proc. Natl. Acad. Sci. USA. 1992;89:8721–8725. doi: 10.1073/pnas.89.18.8721. - DOI - PMC - PubMed
    1. Dill K.A., Chan H.S. From levinthal to pathways to funnels. Nat. Struct. Biol. 1997;4:10–19. doi: 10.1038/nsb0197-10. - DOI - PubMed
    1. George R.A., Heringa J. SnapDRAGON: A method to delineate protein structural domains from sequence data. J. Mol. Biol. 2002;316:839–851. doi: 10.1006/jmbi.2001.5387. - DOI - PubMed

LinkOut - more resources