. 2016 Oct 20;7(10):e2430.
doi: 10.1038/cddis.2016.288.

miR-125b modulates megakaryocyte maturation by targeting the cell-cycle inhibitor p19INK4D

Affiliations

miR-125b modulates megakaryocyte maturation by targeting the cell-cycle inhibitor p19INK4D

Mingyi Qu et al. Cell Death Dis. .

Abstract

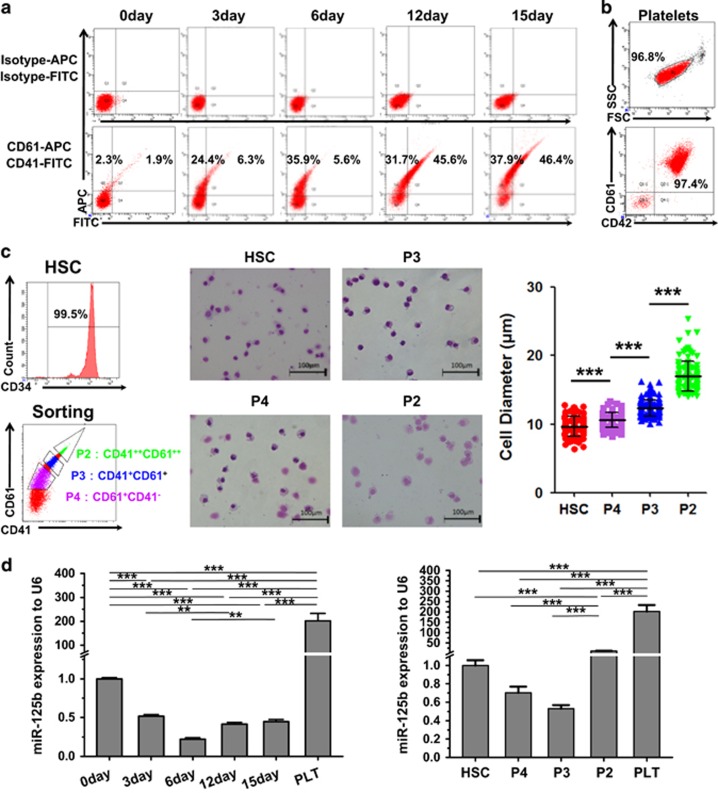
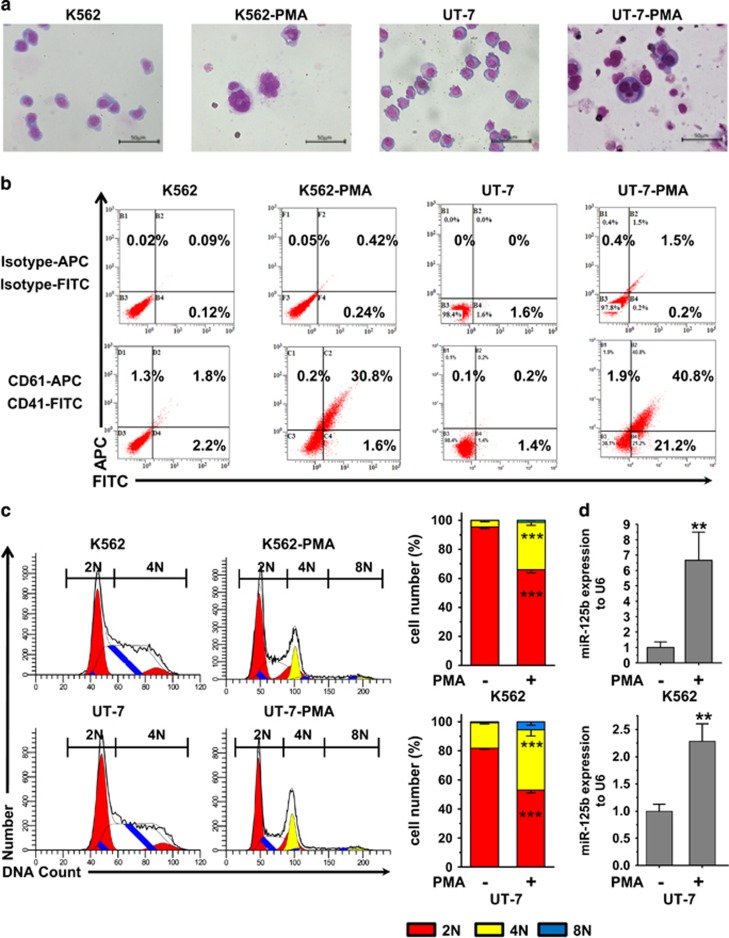
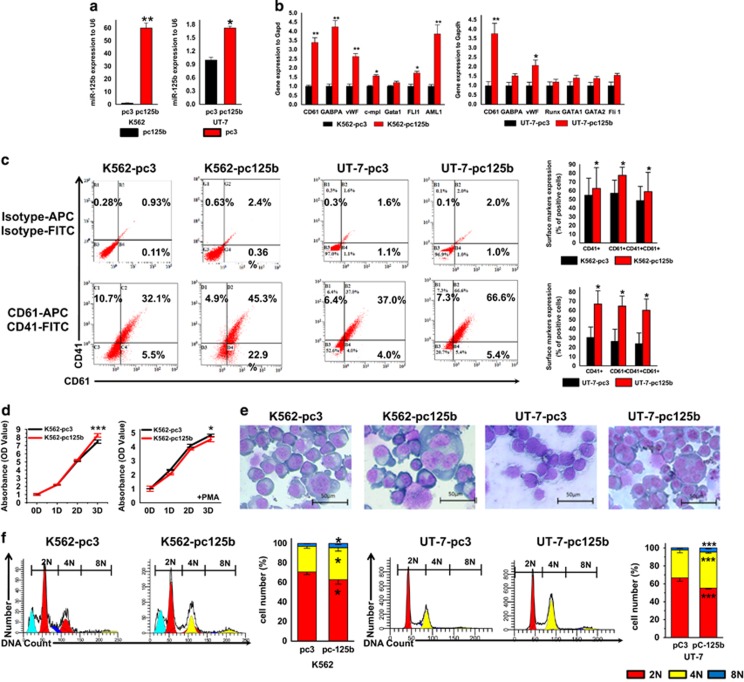
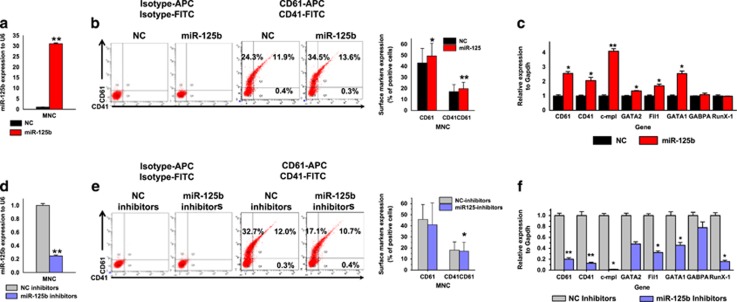
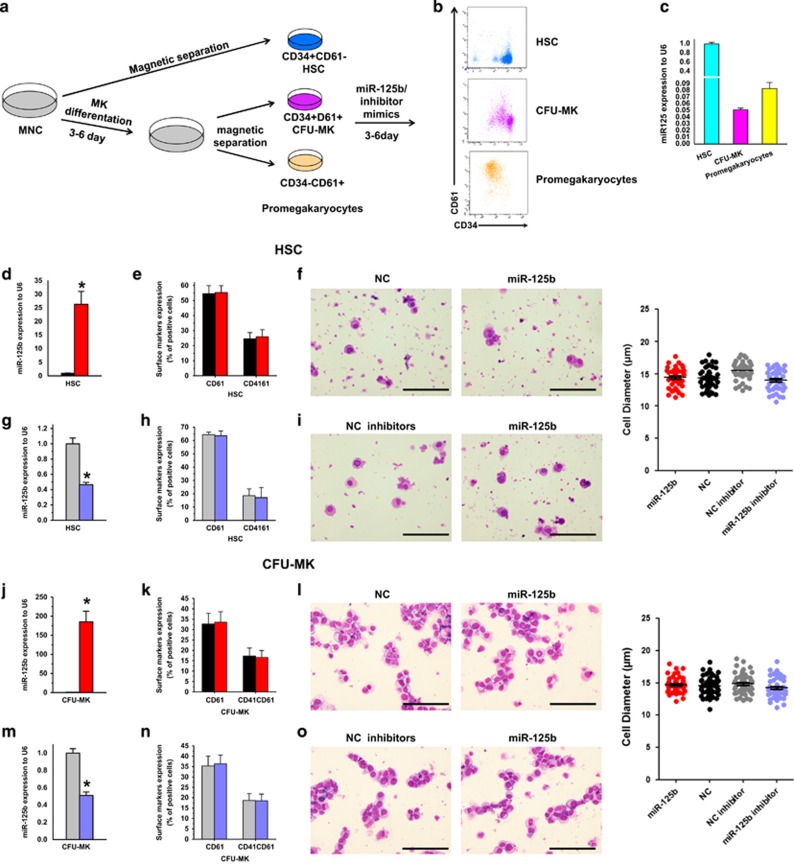
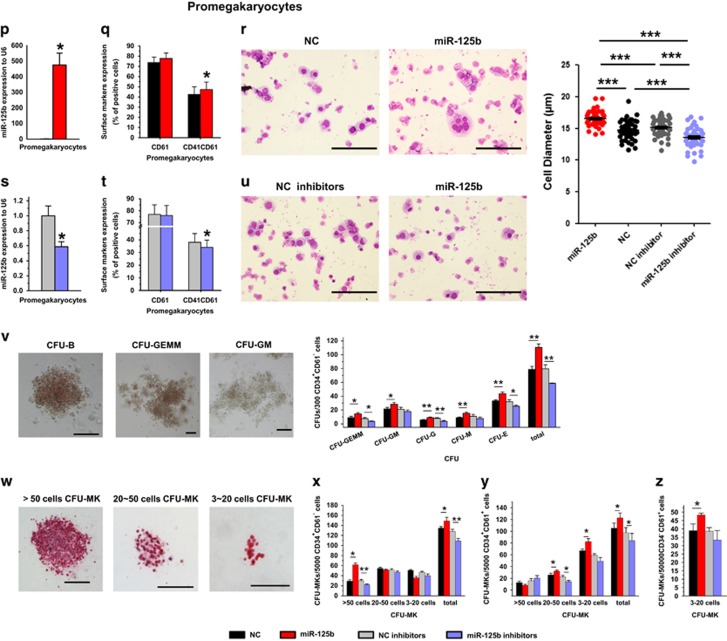
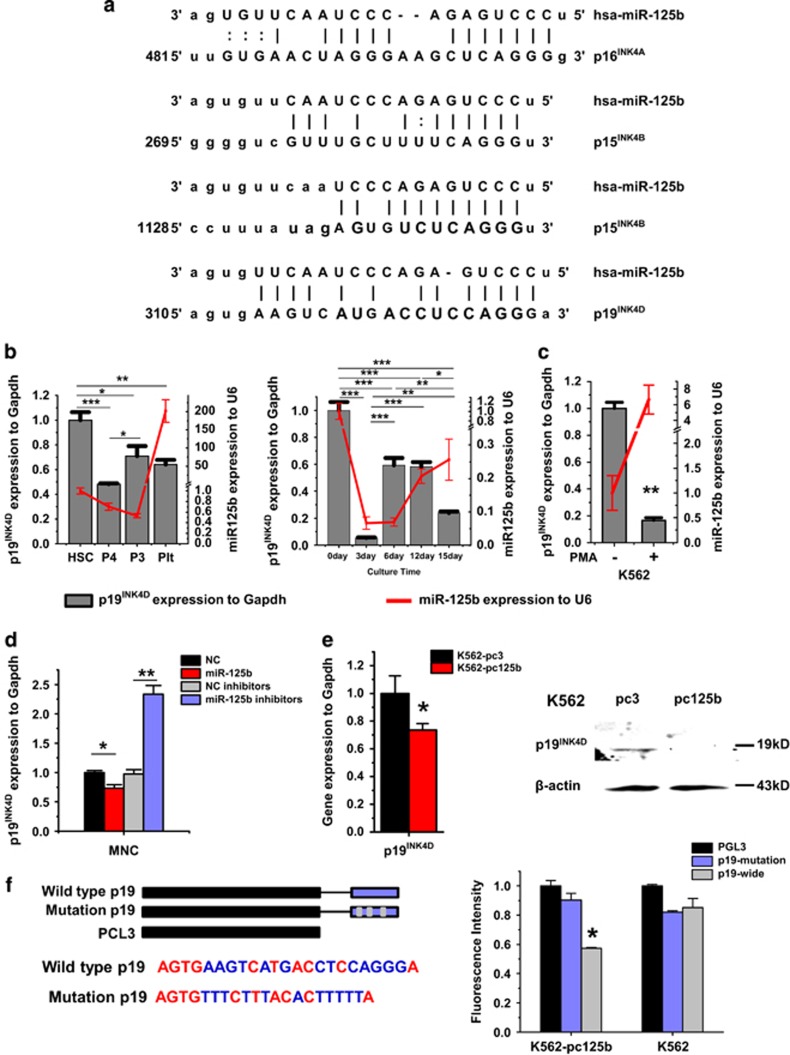
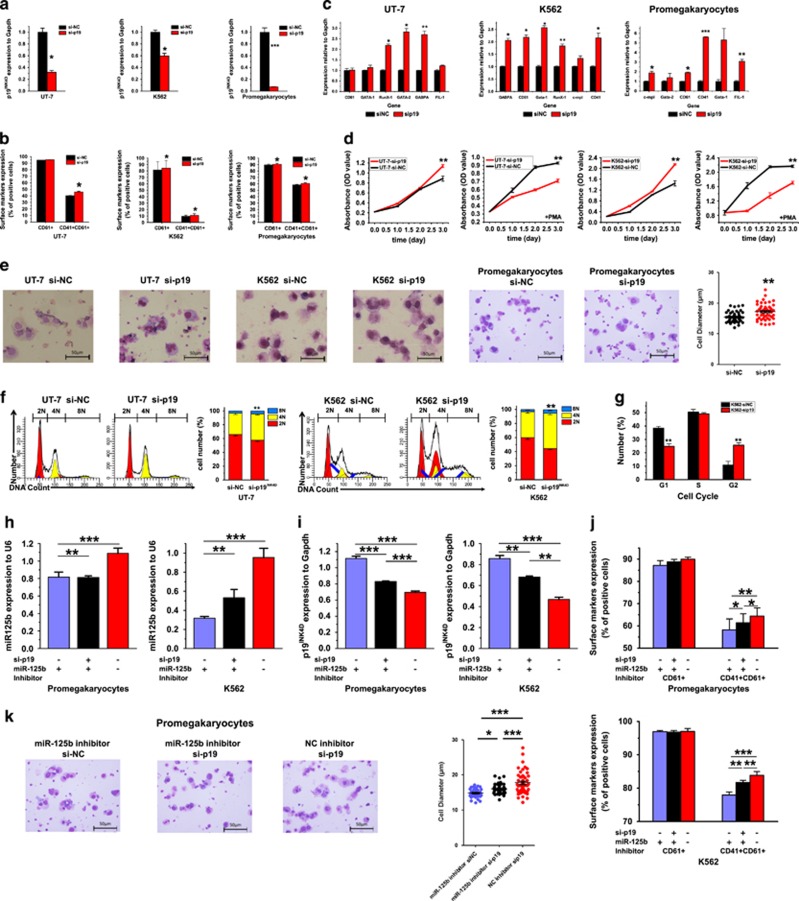
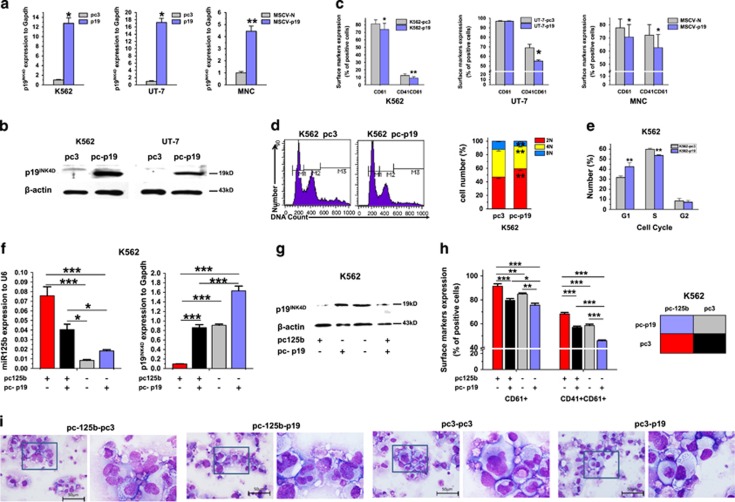
A better understanding of the mechanisms involved in megakaryocyte maturation will facilitate the generation of platelets in vitro and their clinical applications. A microRNA, miR-125b, has been suggested to have important roles in the self-renewal of megakaryocyte-erythroid progenitors and in platelet generation. However, miR-125b is also critical for hematopoietic stem cell self-renewal. Thus, the function of miR-125b and the complex signaling pathways regulating megakaryopoiesis remain to be elucidated. In this study, an attentive examination of the endogenous expression of miR-125b during megakaryocyte differentiation was performed. Accordingly, the differentiation of hematopoietic stem cells requires the downregulation of miR-125b, whereas megakaryocyte determination and maturation synchronize with miR-125b accumulation. The overexpression of miR-125b improves megakaryocytic differentiation of K562 and UT-7 cells. Furthermore, stage-specific overexpression of miR-125b in primary cells demonstrates that miR-125b mediates an enhancement of megakaryocytic differentiation after megakaryocyte determination, the stage at which megakaryocytes are negative for the expression of the hematopoietic progenitor marker CD34. The identification of miR-125b targets during megakaryopoiesis was focused on negative regulators of cell cycle because the transition of the G1/S phase has been associated with megakaryocyte polyploidization. Real-time PCR, western blot and luciferase reporter assay reveal that p19INK4D is a direct target of miR-125b. P19INK4D knockdown using small interfering RNA (siRNA) in megakaryocyte-induced K562 cells, UT-7 cells and CD61+ promegakaryocytes results in S-phase progression and increased polyploidy, as well as improved megakaryocyte differentiation, similarly to the effects of miR-125b overexpression. P19INK4D overexpression reverses these effects, as indicated by reduced expression of megakaryocyte markers, G1-phase arrest and polyploidy decrease. P19INK4D knockdown in miR-125b downregulated cells or p19INK4D overexpression in miR-125b upregulated cells rescued the effect of miR-125b. Taken together, these findings suggest that miR-125b expression positively regulates megakaryocyte development since the initial phases of megakaryocyte determination, and p19INK4D is one of the key mediators of miR-125b activity during the onset of megakaryocyte polyploidization.


Figures

Figure 1
Figure 1
The upregulation of miR-125b is correlated with MK determination and maturation. (a) CD34+ hematopoietic cells were differentiated to MKs by culture in a megakaryocytic differentiation medium. The proportion of CD41+/CD61+ cells is indicated. (b) Isolated PLT from CB samples highly express the surface markers CD61 and CD42. (c) Isolation of CD34+ hematopoietic cells and megakaryoblasts at different stages of development was performed by cell sorting based on the expression levels of surface markers. Morphological difference between different stages was shown by Wright–Giemsa staining. Over 100 cells from five random views were measured. The error bars represent standard deviation (S.D.). Dunnett's test T3 were used for statistical analysis. (d) MiR-125b expression varies in different MK differentiation stages and during each megakaryocytic induction time. MK-specific induction starts with primary human HSCs. Changes in miR-125b were evaluated by qPCR. Comparative miRNA real-time PCR was performed in triplicate, and the expression levels were normalized to U6 miRNA. The error bars represent S.D. All of the data are expressed as the mean±S.D. from three experiments. Cells were obtained from three different donors. Bonferroni's multiple comparison test was used for statistical analysis. ***P<0.001 and **P<0.01
Figure 2
Figure 2
MiR-125b is enriched in PMA-induced K562 and UT-7 megakaryocytic cells. PMA treatment induces megakaryocytic differentiation of K562 and UT-7 cells. (a) Morphology of K562 and UT-7 cells before and after PMA treatment. Cells were stained with Wright–Giemsa solutions. (b) Flow cytometry analysis of CD41 and CD61. (c) DNA ploidy analysis by flow cytometry of K562 and UT-7 cells. In the ploidy mode, first cell cycle represents diploidy, which is shown by red color. Second cycle is polyploid, which color is yellow. White peaks and peaks filled with blue lines represent the S phase. Cells in the G1 and S phase of diploidy are 2N as judged by chromosome count. 4N is the sum of the G2 and M phase from diploidy and the G1 and S phase from polyploidy. 8N is the G2 and M phase of polyploidy. 2N-PMA versus 2N+PMA and 4N-PMA versus 4N+PMA show significant difference. DNA ploidy up to 8N only can be observed in PMA-treated cells (2N, red; 4N, yellow; 8N, blue). (d) qPCR analysis of miR-125b levels in undifferentiated or PMA-treated K562 and UT-7 cells. The endogenous expression of miR-125b in megakaryocytic cells increases after PMA treatment. U6 was used as an endogenous miRNA expression control. All of the data are expressed as the mean±S.D. from at least three independent experiments. Student t-tests were used for statistical analysis. ***P<0.001 and ** P<0.01
Figure 3
Figure 3
Overexpression of miR-125b promotes megakaryocytic differentiation and polyploidization of K562 and UT-7 cells. (a) In K562 and UT-7 cells, transfection with pcDNA3.1-pri-miR-125b effectively increases miR-125b expression compared with the pcDNA3.1 vector transfection control. (b) In K562- and UT-7-stable transfectants, overexpression of miR-125b upregulates the MK-specific genes when treated with PMA. Relative expression of MK marker genes was analyzed by qPCR. (c) The effect of the miR-125b expression construct on the percentage of MKs (CD41+CD61+). Representative flow cytometry plots are shown. (d) CCK8 assay was used to evaluate the proliferation of the miR-125b-modified K562 cells with (right panel) or without (left panel) PMA treatment. (e) In K562- and UT-7-stable transfectants, miR-125b overexpression facilitates the occurrence of megakaryocytic morphology after PMA treatment. Cytospin-prepared MKs were stained with Wright–Giemsa solutions. (f) Ploidy status of PMA-treated cells was assessed by flow cytometry after PI staining. A representative experiment is shown on the right panel, as well as the mean (±S.D.) percentage of cells in each ploidy (2N, red; 4N, yellow; 8N, blue). All of the data are expressed as the mean±S.D. from four independent experiments. T-tests were used for statistical analysis. *P<0.05, **P<0.01 and ***P<0.001 (scale bars: 50 μm)
Figure 4
Figure 4
Effect of miR-125b mimics and inhibitors on MK differentiation of human umbilical CB MNCs. Cells were cultured in a megakaryocytic differentiation medium for 6 days, and transiently transfected with miR-125b mimics or inhibitors at day 1. (a) Relative miR-125b expression analyzed by qPCR. miR-125b expression is normalized to U6. (b) Overexpression of miR-125b in MNCs induces the expression of the MK integrins CD41 and CD61. (c) Relative expression of MK marker genes. Glyceraldehyde 3-phosphate dehydrogenase (GAPDH) was used as a housekeeping control in the experiment. qPCR results from cells transfected with NC mimics are assigned an arbitrary value of 1. (d) Transient transfection of the designated inhibitor effectively downregulates the expression of miR-125b. (e) Downregulated miR-125b expression in MNCs reduces the expression of the MK integrins CD41 and CD61. (f) Relative expression of MK marker genes. GAPDH was used as a housekeeping control in the experiment. qPCR results from cells transfected with NC inhibitor mimics are assigned an arbitrary value of 1. Cells were obtained from four different donors and each sample was tested with three independent experiments for data presentation. All of the data are expressed as mean±S.D. Student's t-tests were used for statistical analysis. *P<0.05 and **P<0.01
Figure 5
Figure 5
Alteration of miR-125b in human hematopoietic stem/progenitor cells, CFU-MK cells and pro-MKs have different effects on MK differentiation. (a) Schematic illustration of the experimental setup and the expression of differentiation markers during human megakaryocytic differentiation. (b) The expression of CD34 and CD61 on cells isolated by magnetic sorting, which represent different developmental stages of human MKs. (c) qPCR analysis of miR-125b expression at different stages of MK differentiation. (d, g, j, m, p and s) Relative miR-125b expression analyzed by qPCR. miR-125b expression is normalized to U6. (e, h, k, n, q and t) Altered expression of miR-125b influences the expression of MK integrins CD41 and CD61. (f, i, l, o, r and u) Altered expression of miR-125b impacts on megakaryocytic morphology and cell dimension. Cytospin-prepared MKs were stained with Wright–Giemsa solutions. Over 50 pro-MKs from five random views were measured. The error bars represent standard deviation (S.D.). Dunnett's test T3 were used for statistical analysis. (v) The typical morphology of CFU-E, CFU-GM, CFU-GEMM and quantification of CFUs with methylcellulose-based colony-forming assays of miR-125b, miR-125b inhibitor, NC and NC inhibitor-modified HSPCs. (w) Different size of CFU-MK colonies stained with human CD41 antibody. (xz) Calculation of CFU-MKs with megacul colony-forming assays of miR-125b, miR-125b inhibitor, NC and NC inhibitors modification at different stages of human MK differentiation. Cells were obtained from four different donors and each sample was tested with three independent experiments for data presentation. All of the data are expressed as mean±S.D. Student's t-tests were used for statistical analysis. *P<0.05, **P<0.01 and ***P<0.001 (scale bars: 100 μm)
Figure 5
Figure 5
Alteration of miR-125b in human hematopoietic stem/progenitor cells, CFU-MK cells and pro-MKs have different effects on MK differentiation. (a) Schematic illustration of the experimental setup and the expression of differentiation markers during human megakaryocytic differentiation. (b) The expression of CD34 and CD61 on cells isolated by magnetic sorting, which represent different developmental stages of human MKs. (c) qPCR analysis of miR-125b expression at different stages of MK differentiation. (d, g, j, m, p and s) Relative miR-125b expression analyzed by qPCR. miR-125b expression is normalized to U6. (e, h, k, n, q and t) Altered expression of miR-125b influences the expression of MK integrins CD41 and CD61. (f, i, l, o, r and u) Altered expression of miR-125b impacts on megakaryocytic morphology and cell dimension. Cytospin-prepared MKs were stained with Wright–Giemsa solutions. Over 50 pro-MKs from five random views were measured. The error bars represent standard deviation (S.D.). Dunnett's test T3 were used for statistical analysis. (v) The typical morphology of CFU-E, CFU-GM, CFU-GEMM and quantification of CFUs with methylcellulose-based colony-forming assays of miR-125b, miR-125b inhibitor, NC and NC inhibitor-modified HSPCs. (w) Different size of CFU-MK colonies stained with human CD41 antibody. (xz) Calculation of CFU-MKs with megacul colony-forming assays of miR-125b, miR-125b inhibitor, NC and NC inhibitors modification at different stages of human MK differentiation. Cells were obtained from four different donors and each sample was tested with three independent experiments for data presentation. All of the data are expressed as mean±S.D. Student's t-tests were used for statistical analysis. *P<0.05, **P<0.01 and ***P<0.001 (scale bars: 100 μm)
Figure 6
Figure 6
Scan for miR-125b target genes during MK differentiation. P19INK4D is a direct target of miR-125b. (a) Bioinformatic analysis of the potential interactions between miR-125b and the 3′-UTR of genes from the INK4 family. (b) The expression pattern of p19INK4D during MK differentiation, as well as at distinct stages of maturation. The megakaryocytic induction begins with CD34+ hematopoietic precursors. (c) qPCR analysis of p19INK4D levels in untreated or PMA-treated K562 cells. Glyceraldehyde 3-phosphate dehydrogenase (GAPDH) was used as an endogenous expression control. (d) P19INK4D is upregulated upon miR-125b silencing; in contrast, p19INK4D is efficiently downregulated after miR-125b overexpression. (e) P19INK4D expression at the mRNA and protein levels in K562 cells stably transfected with pcDNA3.1 (control) or pcDNA3.1-pri-miR-125b were evaluated by qPCR and western blot, respectively. (f) Putative miR-125b binding sequence in the p19INK4D 3′-UTR, and the designed scheme for wild-type and mutant recognition fragments from p19INK4D 3′-UTR. Relative luciferase activity indicates direct binding and function of miR-125b on the p19INK4D 3′-UTR. miR-125b downregulates p19INK4D by interacting with its 3′-UTR. Relative repression of firefly luciferase activity was normalized to a transfection control. Individual comparisons between each groups were performed using Student's paired t-test. Bonferroni's multiple comparison test for multiple comparisons was applied. *P<0.05, **P<0.01 and ***P<0.001
Figure 7
Figure 7
Direct downregulation of p19INK4D promotes MK differentiation of K562 cells, UT-7 cells and pro-MKs. (a) Cells are transiently transfected with the indicated siRNA mimics for 24 h. Relative p19INK4D expression was analyzed by qPCR. (b) K562 and UT-7 cells were transfected with the indicated siRNA and then treated with a suboptimal amount of PMA (1 nM) for 3 days. Megakaryocytic marker genes were analyzed by qPCR. (c) Differentiation markers were analyzed by flow cytometry. (d) Cell proliferation capacity of K562 and UT-7 cells transfected with sip19INK4D or a control siRNA mimics (in the presence or absence of PMA treatment) was measured by CCK8 assay. (e) MK morphology. Cytospin-prepared MKs were stained with Wright–Giemsa solutions. Over 50 pro-MKs from five random views were measured. The error bars represent standard deviation (S.D.). (f) Ploidy status of PMA-treated K562 cells was assessed by flow cytometry after PI staining. A representative experiment is shown on the right panel, as well as the mean (±S.D.) percentage of cells in each ploidy (2N, red; 4N, yellow; 8N, blue). (g) Percentage of K562 cells in each cell-cycle phase. (h and i) Histograms of miR-125b and p19INK4D mRNA in K562 cells or pro-MKs 48 h after co- transfection with miR-125b inhibitor mimics/NC inhibitors and p19INK4D siRNA/control siRNA. (j) Differentiation markers were analyzed by flow cytometry. (k) MK morphology. Cytospin-prepared MKs were stained with Wright–Giemsa solutions. Over 50 pro-MKs from five random views were measured. The error bars represent standard deviation (S.D.). Dunnett's test T3 were used for statistical analysis. Cells were obtained from four different donors and each sample was tested with three independent experiments for data presentation. The results are presented as mean±S.D. Individual comparisons between two groups were performed using Student's paired t-test. Bonferroni's multiple comparison test for multiple comparisons was applied. *P<0.05, **P<0.01 and ***P<0.001 (scale bars: 50 μm)
Figure 8
Figure 8
Enforced p19INK4D expression reduces MK differentiation. (a) P19INK4D expression was measured in K562 and UT-7 cells stably transfected with pcDNA3.1 (control) or pcDNA3.1-p19INK4D and MNCs infected with HA-tagged p19IK4D-expressing retrovirus by qPCR. Error bars represent the standard deviation of the mean of three repeated experiments. (b) Western blot analysis of p19INK4D expression in K562 and UT-7 cells overexpressing p19INK4D. (c) Overexpression of p19INK4D reduced expression of MK markers in K562 cells, UT-7 cells and mononuclears, as assessed by flow cytometry. (d) DNA ploidy analysis by flow cytometry of K562 cells stably transfected with pcDNA3.1 (control) or pcDNA3.1-p19INK4D. A representative experiment is shown on the right panel, as well as the mean (±S.D.) percentage of cells in each ploidy (2N, red; 4N, yellow; 8N, blue). (e) Percentage of cells in each cell-cycle phase from p19INK4D-overexpressing K562 cells. (f) P19INK4D and miR-125b expression were measured in K562 cells stably co-transfected with pcDNA3.1-puromycin/pcDNA3.1-p19INK4D-puromycin and pcDNA3.1-neomycin/pcDNA3.1-pri-miR-125b-neomycin by qPCR. (g) Western blot analysis of p19INK4D- and miR-125b-comodified K562 cells. (h) Flow cytometry analyses of MK marker expression. (i) MK morphology change after p19INK4D and miR-125b comodification. All of the data are expressed as mean±S.D. from at least three independent experiments. Individual comparisons between two groups were performed using Student's paired t-test. Bonferroni's multiple comparison test for multiple comparisons was applied. *P<0.05 and **P<0.01 (scale bars: 50 μm)

Similar articles

Cited by

References

    1. Bartel DP, Micrornas. Genomics, biogenesis, mechanism, and function. Cell 2004; 116: 281–297. - PubMed
    1. Havelange V, Garzon R. Micrornas: emerging key regulators of hematopoiesis. Am J Hematol 2010; 85: 935–942. - PubMed
    1. Edelstein LC, Bray PF. MicroRNAs in platelet production and activation. Blood 2011; 117: 5289–5296. - PMC - PubMed
    1. Klusmann J-H, Li Z, Böhmer K, Maroz A, Koch ML, Emmrich S et al. Mir-125b-2 is a potential oncomir on human chromosome 21 in megakaryoblastic leukemia. Genes Dev 2010; 24: 478–490. - PMC - PubMed
    1. Emmrich S, Henke K, Hegermann J, Ochs M, Reinhardt D, Klusmann J-H. Mirnas can increase the efficiency of ex vivo platelet generation. Ann Hematol 2012; 91: 1673–1684. - PubMed

Publication types

MeSH terms