. 2016 Oct;27(5):197-208.
doi: 10.1089/hgtb.2016.059.

Application of Droplet Digital PCR for Estimating Vector Copy Number States in Stem Cell Gene Therapy

Affiliations

Application of Droplet Digital PCR for Estimating Vector Copy Number States in Stem Cell Gene Therapy

Huan-Ting Lin et al. Hum Gene Ther Methods. 2016 Oct.

Abstract

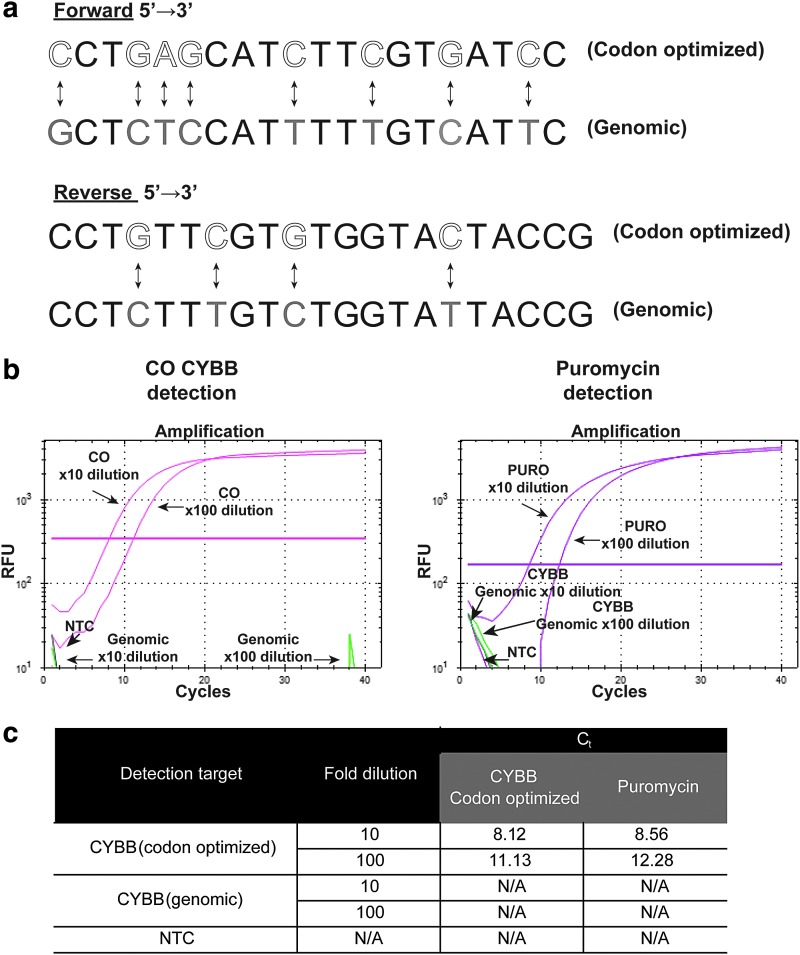
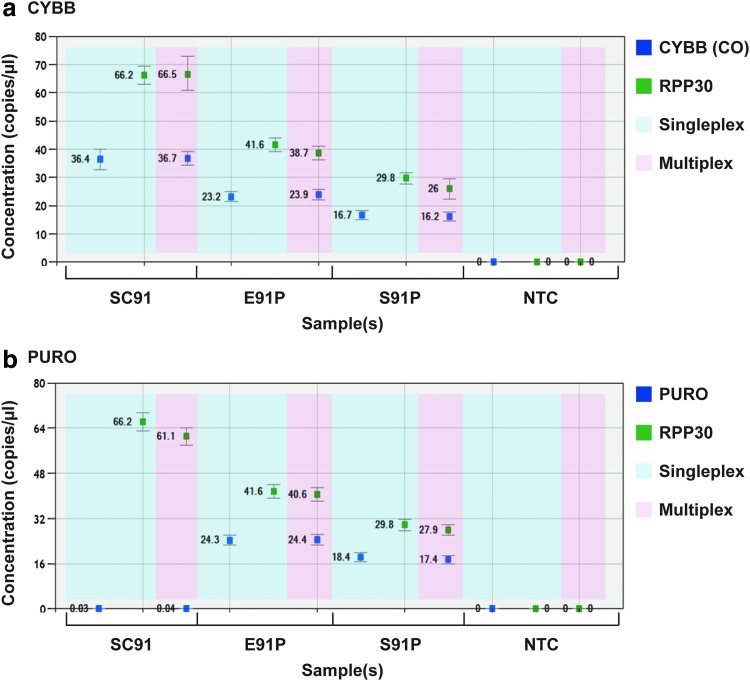
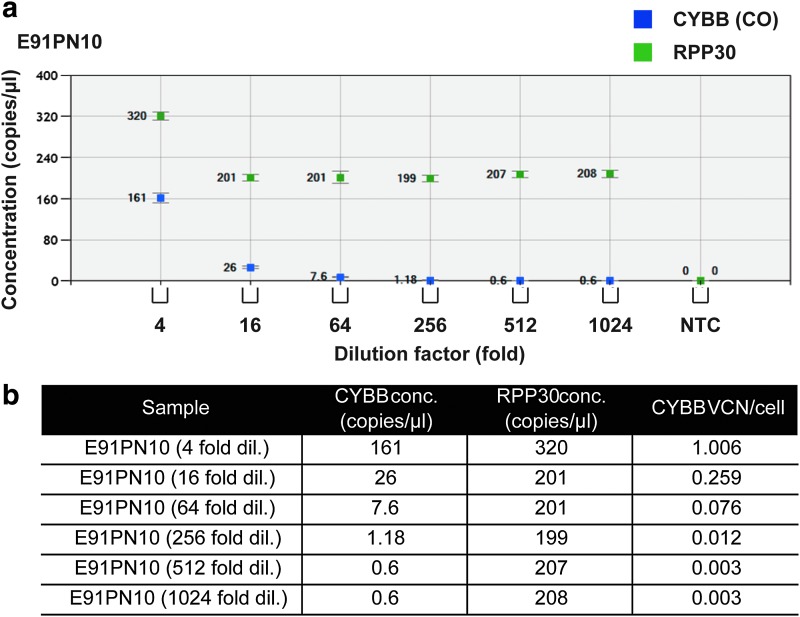
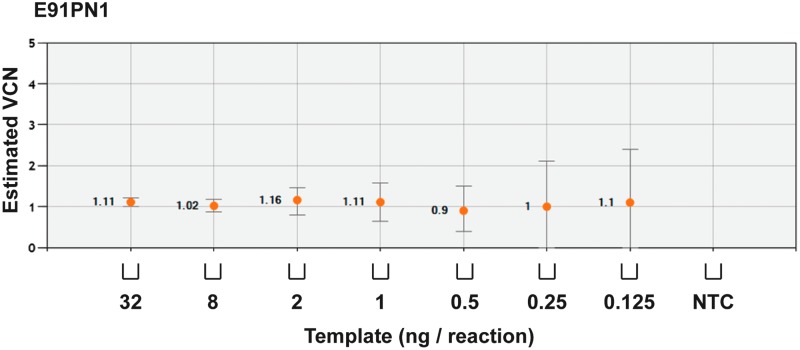
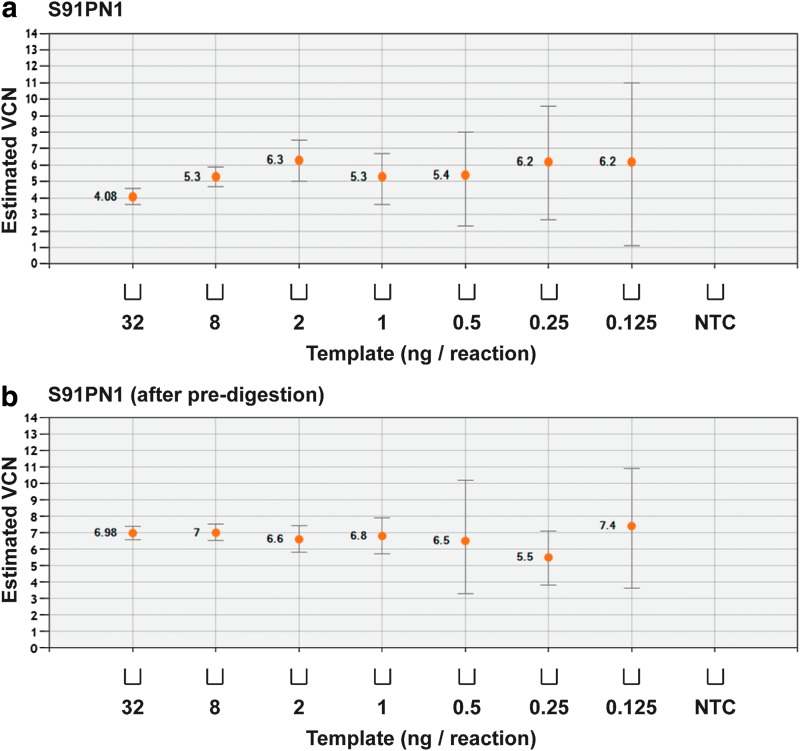
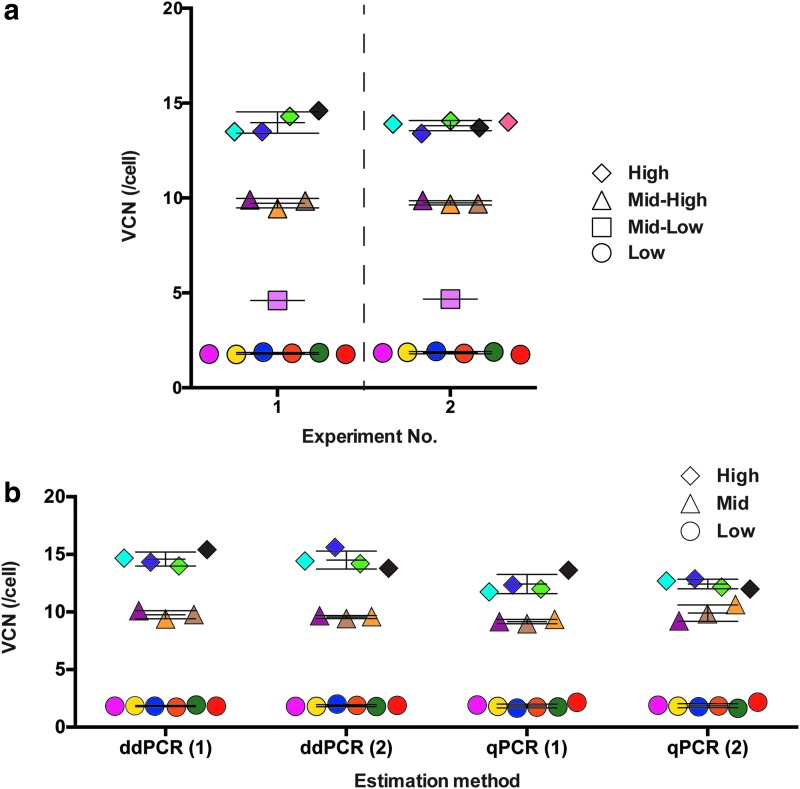
Stable gene transfer into target cell populations via integrating viral vectors is widely used in stem cell gene therapy (SCGT). Accurate vector copy number (VCN) estimation has become increasingly important. However, existing methods of estimation such as real-time quantitative PCR are more restricted in practicality, especially during clinical trials, given the limited availability of sample materials from patients. This study demonstrates the application of an emerging technology called droplet digital PCR (ddPCR) in estimating VCN states in the context of SCGT. Induced pluripotent stem cells (iPSCs) derived from a patient with X-linked chronic granulomatous disease were used as clonable target cells for transduction with alpharetroviral vectors harboring codon-optimized CYBB cDNA. Precise primer-probe design followed by multiplex analysis conferred assay specificity. Accurate estimation of per-cell VCN values was possible without reliance on a reference standard curve. Sensitivity was high and the dynamic range of detection was wide. Assay reliability was validated by observation of consistent, reproducible, and distinct VCN clustering patterns for clones of transduced iPSCs with varying numbers of transgene copies. Taken together, use of ddPCR appears to offer a practical and robust approach to VCN estimation with a wide range of clinical and research applications.

Keywords: chronic granulomatous disease; droplet digital PCR; induced pluripotent stem cells; integrating vectors; vector copy number.


Conflict of interest statement

Author Disclosure Y.Y. and S.I. are currently employed by Bio-Rad Laboratories.

Figures

<b>Figure 1.</b>
Figure 1.
Primer design and target specificity. (a) Bidirectional arrows indicate differences in primer design targeting either codon-optimized (CO) (white letters) or genomic (gray letters) CYBB sequences. (b) Amplification curves for the detection of CO CYBB and the puromycin resistance gene (PURO) (pink). As a control, primer probes targeting genomic CYBB (green) were included within the same reaction samples. The plasmid pAlpha.SIN.EFS.gp91s.F2A.PURO.T2A.ΔLNGFR.oPRE was diluted to 10 and 100 times. The horizontal pink line represents Ct (threshold cycle) values. NTC, no-template control; RFU, relative fluorescence units. (c) Tabular summary of CO CYBB and PURO detection alongside respective Ct values. N/A, not applicable (indicates no detection); NTC, no-template control.
<b>Figure 2.</b>
Figure 2.
VCN estimation in PLB cells. To estimate average VCN values, the concentrations (copies/μl) of either (a) CO CYBB (dark blue) or (b) PURO and of the RPP30 reference gene (green) were determined in each sample, using singleplex reactions (light blue, single primer probe) or multiplex reactions (pink, both primer probes). Samples of gDNA were extracted from three different types of PLB cells containing the provirus insertions SC91 (single-copy pAlpha.SIN.EFS.oPRE), E91P (pAlpha.SIN.EFS.IRES.PURO.oPRE), or S91P (pAlpha.SIN.SFFV.IRES.PURO.oPRE).
<b>Figure 3.</b>
Figure 3.
Assay sensitivity after sample dilution with non-codon-optimized CYBB-containing gDNA. (a) To estimate the level of sensitivity of ddPCR, E91PN10 gDNA was diluted using gDNA extracted from transduced XCGD iPSCs that do not contain codon-optimized (CO) CYBB. Indicated are the concentrations of CO CYBB (dark blue) and RPP30 (green). NTC, no-template control. (b) Tabular summary of assay sensitivity. CO CYBB-non-containing gDNA was used to dilute E91PN10 gDNA samples, keeping the concentration of the reference RPP30 gene relatively constant while reducing the concentration of CO CYBB.
<b>Figure 4.</b>
Figure 4.
Determination of assay variability. To determine assay variability with reducing amounts of template, samples were diluted with water to the stated mass of template gDNA. By this method the concentrations of both the target gene and RPP30 were reduced. gDNA was extracted from the E91PN1 line of transduced XCGD-iPSCs (estimated VCN value, 1.1). Error bars represent total error at a 95% confidence interval.
<b>Figure 5.</b>
Figure 5.
Sample predigestion with restriction enzymes reduces assay variability. The S91PN1 line of transduced XCGD-iPSCs was estimated to have an average VCN value of 6.75. Samples were diluted with water to the stated mass of template gDNA: (a) without predigestion or (b) with predigestion, using the restriction enzymes NotI and BglII. Error bars represent total error at a 95% confidence interval.
<b>Figure 6.</b>
Figure 6.
Distribution of VCN in cloned iPSCs. Single-cell clones from three transduced iPSC lines were individually reassessed for VCN values. Each clone is represented by the same-shaped symbol and color. (a) On the basis of the estimated VCN value, clones were grouped into four arbitrary orders of magnitude (low, mid-low, mid-high, and high). Each symbol represents mean values of two independent experiments analyzing the same clone. (b) Direct comparison was made between ddPCR and qPCR by repeating VCN estimation of the same categories of clones (ddPCR Exp #3 and qPCR Exp #2; Supplementary Table S2). To simplify, mid-high becomes mid (mid-low not included). Each symbol represents a single measurement for each independent reaction by either method [ddPCR (1) and (2) or qPCR (1) and (2)]. Error bars (mean ± SD) represent the average VCN within each category and the distribution of each clone.

Similar articles

Cited by

References

    1. Williams DA, Thrasher AJ. Concise review: lessons learned from clinical trials of gene therapy in monogenic immunodeficiency diseases. Stem Cells Transl Med 2014;3:636–642 - PMC - PubMed
    1. Wu C, Dunbar CE. Stem cell gene therapy: the risks of insertional mutagenesis and approaches to minimize genotoxicity. Front Med 2011;5:356–371 - PMC - PubMed
    1. Cantsilieris S, Baird PN, White SJ. Molecular methods for genotyping complex copy number polymorphisms. Genomics 2013;101:86–93 - PubMed
    1. VanGuilder HD, Vrana KE, Freeman WM. Twenty-five years of quantitative PCR for gene expression analysis. Biotechniques 2008;44:619–626 - PubMed
    1. Schmittgen TD, Livak KJ. Analyzing real-time PCR data by the comparative CT method. Nat Protoc 2008;3:1101–1108 - PubMed

Publication types

MeSH terms