

RNAseq reveals hypervirulence-specific host responses to M. tuberculosis infection
- PMID: 27763806
- PMCID: PMC5626229
- DOI: 10.1080/21505594.2016.1250994
RNAseq reveals hypervirulence-specific host responses to M. tuberculosis infection
Abstract
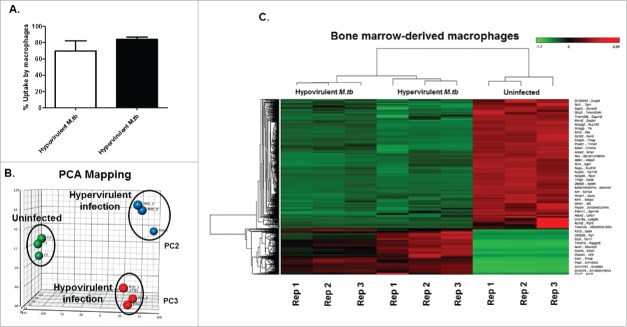
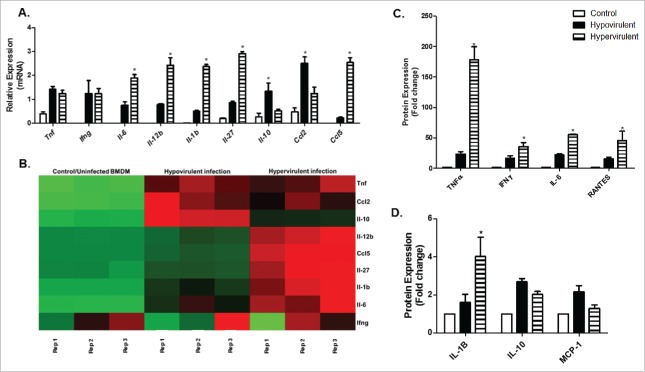
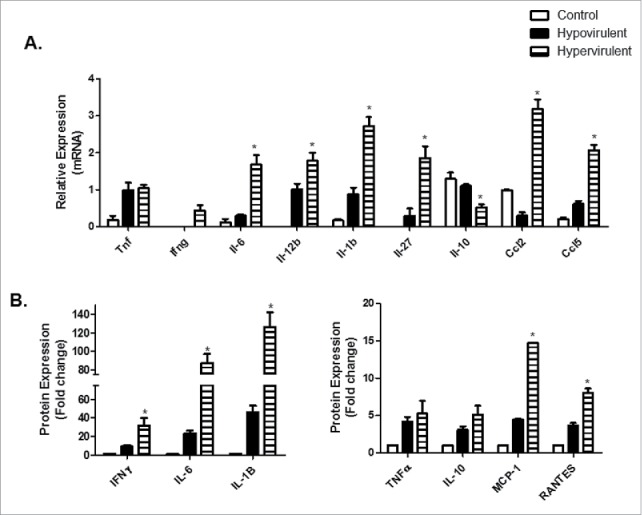
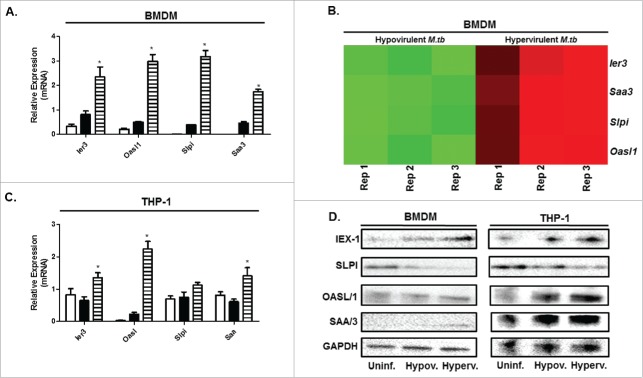
The distinguishing factors that characterize the host response to infection with virulent Mycobacterium tuberculosis (M.tb) are largely confounding. We present an infection study with 2 genetically closely related M.tb strains that have vastly different pathogenic characteristics. The early host response to infection with these detergent-free cultured strains was analyzed through RNAseq in an attempt to provide information on the subtleties which may ultimately contribute to the virulent phenotype. Murine bone marrow derived macrophages (BMDMs) were infected with either a hyper- (R5527) or hypovirulent (R1507) Beijing M. tuberculosis clinical isolate. RNAseq revealed 69 differentially expressed host genes in BMDMs during comparison of these 2 transcriptomes. Pathway analysis revealed activation of the stress-induced and growth inhibitory Gadd45 signaling pathway in hypervirulent infected BMDMs. Upstream regulators of interferon activation such as and IRF3 and IRF7 were predicted to be upregulated in hypovirulent-infected BMDMs. Additional analysis of the host immune response through ELISA and qPCR included the use of human THP-1 macrophages where a robust proinflammatory response was observed after infection with the hypervirulent strain. RNAseq revealed 2 early-response genes (ier3 and saa3) and 2 host-defense genes (oasl1 and slpi) that were significantly upregulated by the hypervirulent strain. The role of these genes under M.tb infection conditions are largely unknown but here we provide validation of their presence with use of qPCR and Western blot. Further analysis into their biological role during infection with virulent M.tb is required.
Keywords: RNAseq; host-response; infection; mycobacterium tuberculosis; virulence.
Figures
Comment in
-
Trick or tween: An inflammatory surprise when M. tuberculosis knocks a cell's door and no tween is provided.Virulence. 2017 Aug 18;8(6):632-634. doi: 10.1080/21505594.2016.1257460. Epub 2016 Nov 7. Virulence. 2017. PMID: 27820666 Free PMC article. No abstract available.
Similar articles
-
Comparative transcriptomic analysis of THP-1-derived macrophages infected with Mycobacterium tuberculosis H37Rv, H37Ra and BCG.J Cell Mol Med. 2021 Nov;25(22):10504-10520. doi: 10.1111/jcmm.16980. Epub 2021 Oct 10. J Cell Mol Med. 2021. PMID: 34632719 Free PMC article.
-
The Host Response to a Clinical MDR Mycobacterial Strain Cultured in a Detergent-Free Environment: A Global Transcriptomics Approach.PLoS One. 2016 Apr 7;11(4):e0153079. doi: 10.1371/journal.pone.0153079. eCollection 2016. PLoS One. 2016. PMID: 27055235 Free PMC article.
-
Transcriptional regulators SP110 and SP140 modulate inflammatory response genes in Mycobacterium tuberculosis-infected human macrophages.Microbiol Spectr. 2024 Oct 3;12(10):e0010124. doi: 10.1128/spectrum.00101-24. Epub 2024 Aug 20. Microbiol Spectr. 2024. PMID: 39162523 Free PMC article.
-
Shaping the niche in macrophages: Genetic diversity of the M. tuberculosis complex and its consequences for the infected host.Int J Med Microbiol. 2018 Jan;308(1):118-128. doi: 10.1016/j.ijmm.2017.09.009. Epub 2017 Sep 14. Int J Med Microbiol. 2018. PMID: 28969988 Review.
-
Cell death at the cross roads of host-pathogen interaction in Mycobacterium tuberculosis infection.Tuberculosis (Edinb). 2018 Dec;113:99-121. doi: 10.1016/j.tube.2018.09.007. Epub 2018 Sep 29. Tuberculosis (Edinb). 2018. PMID: 30514519 Review.
Cited by
-
Trick or tween: An inflammatory surprise when M. tuberculosis knocks a cell's door and no tween is provided.Virulence. 2017 Aug 18;8(6):632-634. doi: 10.1080/21505594.2016.1257460. Epub 2016 Nov 7. Virulence. 2017. PMID: 27820666 Free PMC article. No abstract available.
-
Gadd45 Proteins in Immunity 2.0.Adv Exp Med Biol. 2022;1360:69-86. doi: 10.1007/978-3-030-94804-7_5. Adv Exp Med Biol. 2022. PMID: 35505163
-
AmpliSeq transcriptome analysis of human alveolar and monocyte-derived macrophages over time in response to Mycobacterium tuberculosis infection.PLoS One. 2018 May 30;13(5):e0198221. doi: 10.1371/journal.pone.0198221. eCollection 2018. PLoS One. 2018. PMID: 29847580 Free PMC article.
-
Systems genetics uncover new loci containing functional gene candidates in Mycobacterium tuberculosis-infected Diversity Outbred mice.PLoS Pathog. 2024 Jun 11;20(6):e1011915. doi: 10.1371/journal.ppat.1011915. eCollection 2024 Jun. PLoS Pathog. 2024. PMID: 38861581 Free PMC article.
-
The Association of OASL and Type I Interferons in the Pathogenesis and Survival of Intracellular Replicating Bacterial Species.Front Cell Infect Microbiol. 2017 May 19;7:196. doi: 10.3389/fcimb.2017.00196. eCollection 2017. Front Cell Infect Microbiol. 2017. PMID: 28580319 Free PMC article. Review.
References
-
- Ehlers MRW, Daffé M. Interactions between Mycobacterium tuberculosis and host cells: are mycobacterial sugars the key? Trends Microbiol 1998; 6:328-335; http://dx.doi.org/10.1016/S0966-842X(98)01301-8 - DOI - PubMed
-
- Reiling N, Homolka S, Walter K, Brandenburg J, Niwinski L, Ernst M, Herzmann C, Lange C, Diel R, Ehlers S, et al.. Clade-specific virulence patterns of Mycobacterium tuberculosis complex strains in human primary macrophages and aerogenically infected mice. MBio 2013; 4:e00250-00213; PMID:23900170; http://dx.doi.org/10.1128/mBio.00250-13 - DOI - PMC - PubMed
-
- Wu K, Dong D, Fang H, Levillain F, Jin W, Mei J, Gicquel B, Du Y, Wang K, Gao Q, et al.. An interferon-related signature in the transcriptional core response of human macrophages to Mycobacterium tuberculosis infection. PLoS One 2012; 7:e38367; http://dx.doi.org/10.1371/journal.pone.0038367 - DOI - PMC - PubMed
-
- Manca C, Tsenova L, Barry CE 3rd, Bergtold A, Freeman S, Haslett PA, Musser JM, Freedman VH, Kaplan G. Mycobacterium tuberculosis CDC1551 induces a more vigorous host response in vivo and in vitro, but is not more virulent than other clinical isolates. J Immunol 1999; 162:6740-6; PMID:10352293 - PubMed
-
- Manca C, Tsenova L, Bergtold A, Freeman S, Tovey M, Musser JM, Barry CE 3rd, Freedman VH, Kaplan G. Virulence of a Mycobacterium tuberculosis clinical isolate in mice is determined by failure to induce Th1 type immunity and is associated with induction of IFN-α /β. Proc Natl Acad Sci U S A 2001; 98:5752-7; PMID:11320211; http://dx.doi.org/10.1073/pnas.091096998 - DOI - PMC - PubMed
MeSH terms
Substances
LinkOut - more resources
Full Text Sources
Other Literature Sources
Medical
Molecular Biology Databases