

Culture at low glucose up-regulates mitochondrial function in pancreatic β cells with accompanying effects on viability
- PMID: 27763807
- PMCID: PMC5161144
- DOI: 10.1080/19382014.2016.1246637
Culture at low glucose up-regulates mitochondrial function in pancreatic β cells with accompanying effects on viability
Abstract
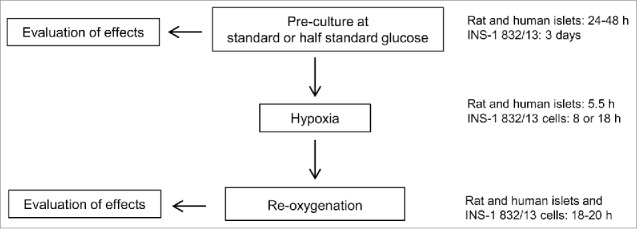
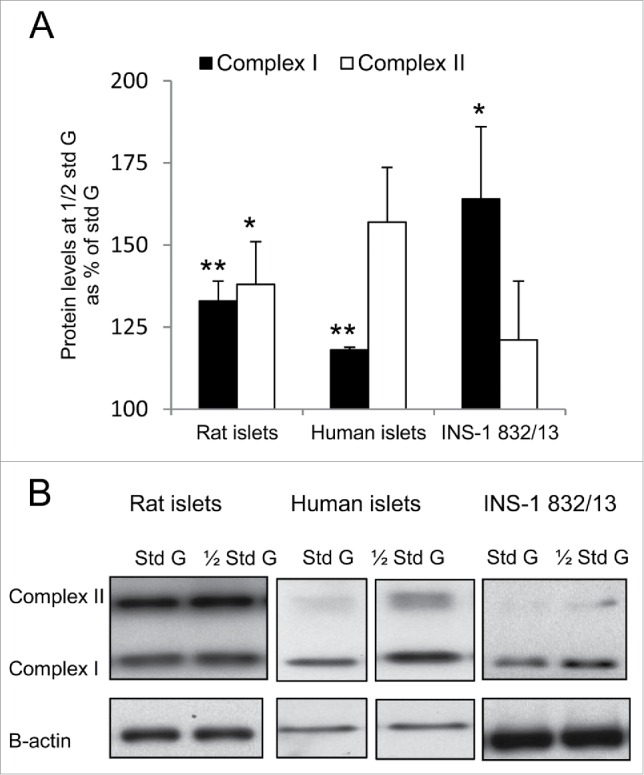
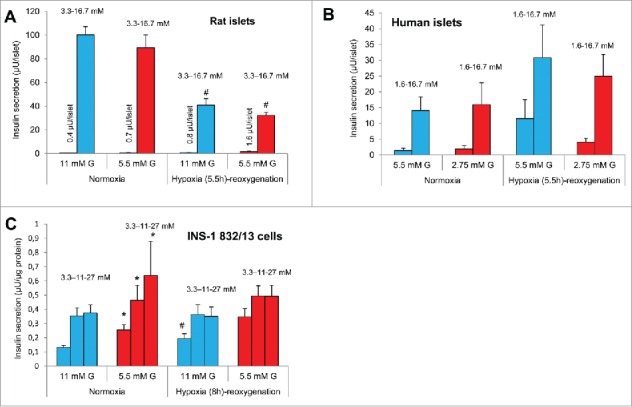
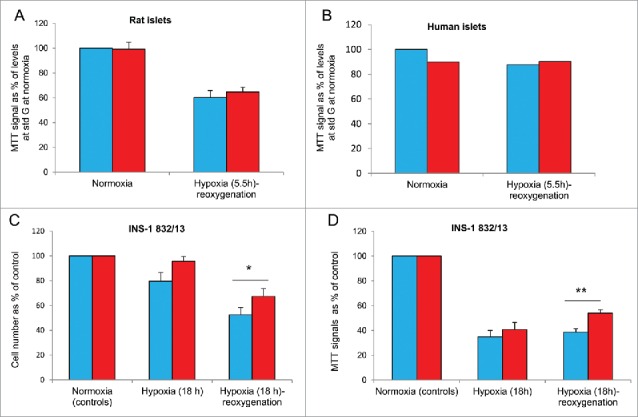
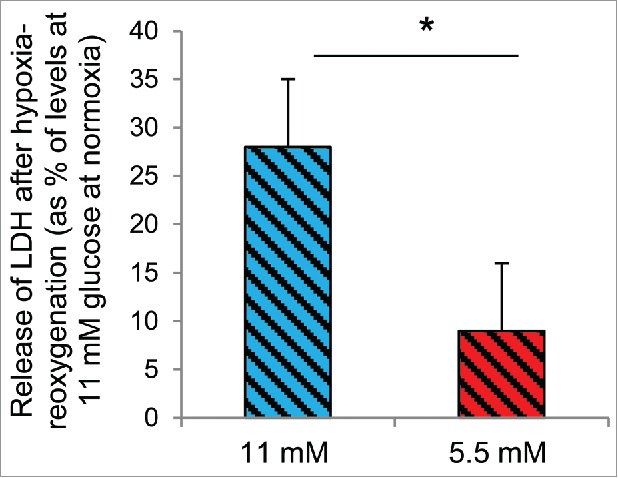
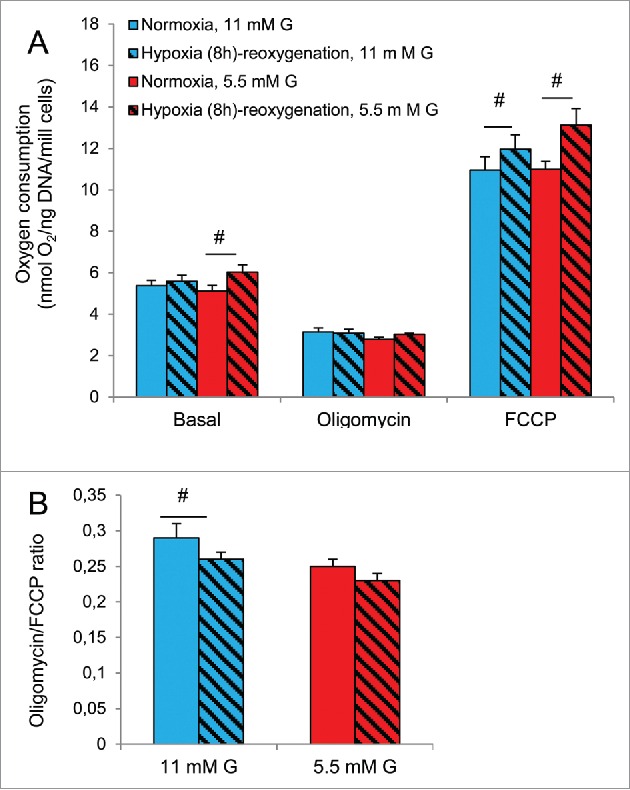
We tested whether exposure of β cells at reduced glucose leads to mitochondrial adaptions and whether such adaptions modulate effects of hypoxia. Rat islets, human islets and INS-1 832/13 cells were pre-cultured short term at half standard glucose concentrations (5.5 mM for rat islets and cells, 2.75 mM for human islets) without overtly negative effects on subsequently measured function (insulin secretion and cellular insulin contents) or on viability. Culture at half standard glucose upregulated complex I and tended to upregulate complex II in islets and INS-1 cells alike. An increased release of lactate dehydrogenase that followed exposure to hypoxia was attenuated in rat islets which had been pre-cultured at half standard glucose. In INS-1 cells exposure to half standard glucose attenuated hypoxia-induced effects on several viability parameters (MTT, cell number and incremental apoptotic DNA). Thus culture at reduced glucose of pancreatic islets and clonal β cells leads to mitochondrial adaptions which possibly lessen the negative impact of hypoxia on β cell viability. These findings appear relevant in the search for optimization of pre-transplant conditions in a clinical setting.
Keywords: INS-1; hypoxia; insulin secretion; low glucose; mitochondrial complexes; oxygen consumption; rat and human islets; viability.
Figures
Similar articles
-
Hyperoxia inhibits glucose-induced insulin secretion and mitochondrial metabolism in rat pancreatic islets.Biochem Biophys Res Commun. 2014 Jan 3;443(1):223-8. doi: 10.1016/j.bbrc.2013.11.088. Epub 2013 Dec 2. Biochem Biophys Res Commun. 2014. PMID: 24299957
-
Osteocalcin protects pancreatic beta cell function and survival under high glucose conditions.Biochem Biophys Res Commun. 2015 Jun 19;462(1):21-6. doi: 10.1016/j.bbrc.2015.04.095. Epub 2015 Apr 27. Biochem Biophys Res Commun. 2015. PMID: 25930995
-
Mitochondrial Respiration in Insulin-Producing β-Cells: General Characteristics and Adaptive Effects of Hypoxia.PLoS One. 2015 Sep 24;10(9):e0138558. doi: 10.1371/journal.pone.0138558. eCollection 2015. PLoS One. 2015. PMID: 26401848 Free PMC article.
-
Hyperoxia reduces insulin release and induces mitochondrial dysfunction with possible implications for hyperoxic treatment of neonates.Physiol Rep. 2017 Oct;5(19):e13447. doi: 10.14814/phy2.13447. Epub 2017 Oct 16. Physiol Rep. 2017. PMID: 29038359 Free PMC article.
-
Unique and Shared Metabolic Regulation in Clonal β-Cells and Primary Islets Derived From Rat Revealed by Metabolomics Analysis.Endocrinology. 2015 Jun;156(6):1995-2005. doi: 10.1210/en.2014-1391. Epub 2015 Mar 16. Endocrinology. 2015. PMID: 25774549
Cited by
-
Modelling human placental villous development: designing cultures that reflect anatomy.Cell Mol Life Sci. 2022 Jun 26;79(7):384. doi: 10.1007/s00018-022-04407-x. Cell Mol Life Sci. 2022. PMID: 35753002 Free PMC article. Review.
-
Time dynamics of elevated glucose and beta-hydroxybutyrate on beta cell mitochondrial metabolism.Islets. 2025 Dec;17(1):2503515. doi: 10.1080/19382014.2025.2503515. Epub 2025 May 19. Islets. 2025. PMID: 40387167 Free PMC article.
References
-
- Calabrese EJ, Baldwin LA. Defining hormesis. Hum Exp Toxicol 2002; 21:91-7; PMID:12102503; http://dx.doi.org/10.1191/0960327102ht217oa - DOI - PubMed
-
- Verges S, Chacaroun S, Godin-Ribuot D, Baillieul S. Hypoxic conditioning as a new therapeutic modality. Front Pediatr 2015; 3:58; PMID:26157787; http://dx.doi.org/10.3389/fped.2015.00058 - DOI - PMC - PubMed
-
- Shapiro AM. State of the art of clinical islet transplantation and novel protocols of immunosuppression. Curr Diab Rep 2011; 11:345-54; PMID:21830042; http://dx.doi.org/10.1007/s11892-011-0217-8 - DOI - PubMed
-
- Deters NA, Stokes RA, Gunton JE. Islet transplantation: factors in short-term islet survival. Arch Immunol Ther Exp (Warsz) 2011; 59:421-9; PMID:21984594 - PubMed
Publication types
MeSH terms
Substances
LinkOut - more resources
Full Text Sources
Other Literature Sources