. 2016 Oct 20;12(10):e1005147.
doi: 10.1371/journal.pcbi.1005147. eCollection 2016 Oct.

The Spatial Dynamics of Predators and the Benefits and Costs of Sharing Information

Affiliations

The Spatial Dynamics of Predators and the Benefits and Costs of Sharing Information

Matthieu Barbier et al. PLoS Comput Biol. .

Abstract

Predators of all kinds, be they lions hunting in the Serengeti or fishermen searching for their catch, display various collective strategies. A common strategy is to share information about the location of prey. However, depending on the spatial characteristics and mobility of predators and prey, information sharing can either improve or hinder individual success. Here, our goal is to investigate the interacting effects of space and information sharing on predation efficiency, represented by the expected rate at which prey are found and consumed. We derive a feeding functional response that accounts for both spatio-temporal heterogeneity and communication, and validate this mathematical analysis with a computational agent-based model. This agent-based model has an explicit yet minimal representation of space, as well as information sharing about the location of prey. The analytical model simplifies predator behavior into a few discrete states and one essential trade-off, between the individual benefit of acquiring information and the cost of creating spatial and temporal correlation between predators. Despite the absence of an explicit spatial dimension in these equations, they quantitatively predict the predator consumption rates measured in the agent-based simulations across the explored parameter space. Together, the mathematical analysis and agent-based simulations identify the conditions for when there is a benefit to sharing information, and also when there is a cost.


Conflict of interest statement

The authors have declared that no competing interests exist.

Figures

Fig 1
Fig 1
Schematics for A) a simple behavioral-state model of predators and their interaction with their prey; and B) for the predator behavioral state-change model, accounting for information sharing.
Fig 2
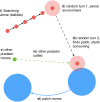
Fig 2. A cartoon describing our agent-based model of predators and prey.
There are six main steps: (I) predators rapidly traverse the domain by moving in a straight line; (II) they randomly stop to sense their local environment, and pick a new direction if no prey patch is found within their sensory radius; (III) if a prey patch is found, the predator moves towards its centre and consumes prey from it; (IV) if a predator has a social tie with another predator who is at a prey patch, then information may be passed between the two, (V) informed predators move towards the nearest prey patch whose location they know; (VI) prey patches make random jumps at a given rate.
Fig 3
Fig 3. General schema of the relationship between the parameters in the numerical agent-based model and in the mathematical behavioral model.
Parameters of the agent-based model represent those that could be measured empirically. These are then used to estimate the key parameters of the mathematical model (grey circles) following the formulae presented in the main text. The analytical model then uses these parameters to calculate the rates of change of predator behavioral states and the spatial correlation metric, all of which are required to derive a functional response that describes the consumption rate as a function of information sharing, and the spatial characteristics of the environment.
Fig 4
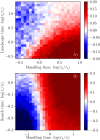
Fig 4. The fractional change of consumption rate between the no-information and full-information sharing cases in a two-predator system.
Values are shown for two parameter spaces: the top-panel (A) shows values for a range of prey patch timescales τl and handling times τh, both normalized by the first passage time τs; the bottom-panel (B) shows values for a range of first passage times τs and handling times τh normalized by the landscape timescales τl. Red and blue areas identify parameters combinations (i.e. environments) where information sharing improved and diminished consumption rates respectively. White areas identify environments in which information sharing had no effect.
Fig 5
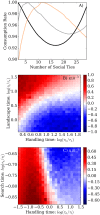
Fig 5
A) Examples of the relationship between expected consumption rate and the number of social ties, for three different environments. These three examples highlight that this relationship can be convex (black line: log(τh/τs) = 1.08, log(τl/τs = 1.5), concave (orange line: log(τh/τs = 1.08, log(τl/τs = −0.08) and sinuous (grey line: log(τh/τl = 0.0, log(τs/τl = −0.66). B and C) show the average curvature for this relationship for the normalized landscape timescale τl (B) and first passage time τs (C) versus handling time τh spaces. Red, white and blue areas are those with convex, flat and concave curves respectively.
Fig 6
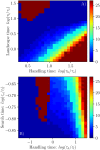
Fig 6
The optimal number of social ties given a total of 30 predators in the system, for (A) the normalized landscape timescale τl and (B) first passage time τs versus handling time τh spaces.

Similar articles

Cited by

References

    1. Couzin ID, Krause J Self-organization and collective behavior in vertebrates. Advances in the Study of Behavior. 2003;32:1–75. 10.1016/S0065-3454(03)01001-5 - DOI
    1. Fryxell JM, Mosser A, Sinclair ARE, Packer C. Group formation stabilizes predator-prey dynamics. Nature. 2007;449(7165):1041–1043. 10.1038/nature06177 - DOI - PubMed
    1. Bastardie F, Nielsen JR, Andersen BS, Eigaard OR. Effects of fishing effort allocation scenarios on energy efficiency and profitability: An individual-based model applied to Danish fisheries. Fisheries Research. 2010;106(3):501–516. 10.1016/j.fishres.2010.09.025 - DOI
    1. Evans KS, Weninger Q Information sharing and cooperative search in fisheries. Environmental and Resource Economics. 2014;58(3):353–372. 10.1007/s10640-013-9701-8 - DOI
    1. Gatewood JB. Cooperation, Competition, and Synergy: Information-sharing Groups among Southeast Alaskan Salmon Seiners. American Ethnologist. 1984;11(2):350–370. 10.1525/ae.1984.11.2.02a00080 - DOI