. 2016 Dec;12(12):2386-2403.
doi: 10.1080/15548627.2016.1240856. Epub 2016 Oct 20.

Human Atg8-cardiolipin interactions in mitophagy: Specific properties of LC3B, GABARAPL2 and GABARAP

Affiliations

Human Atg8-cardiolipin interactions in mitophagy: Specific properties of LC3B, GABARAPL2 and GABARAP

Zuriñe Antón et al. Autophagy. 2016 Dec.

Abstract

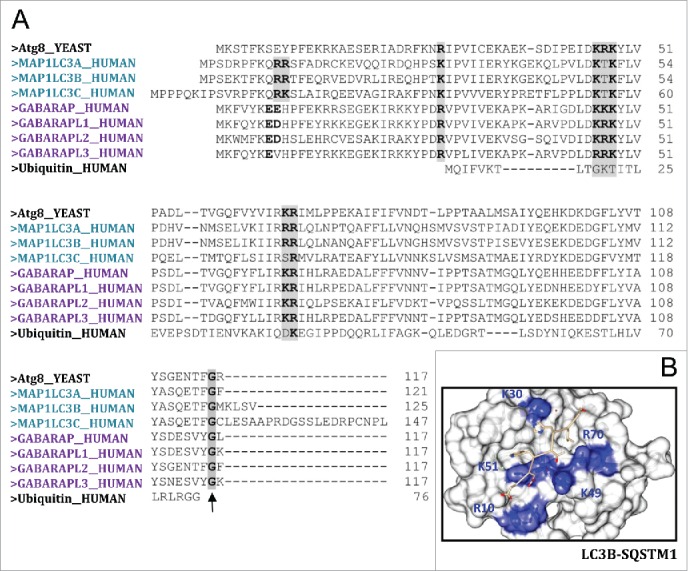
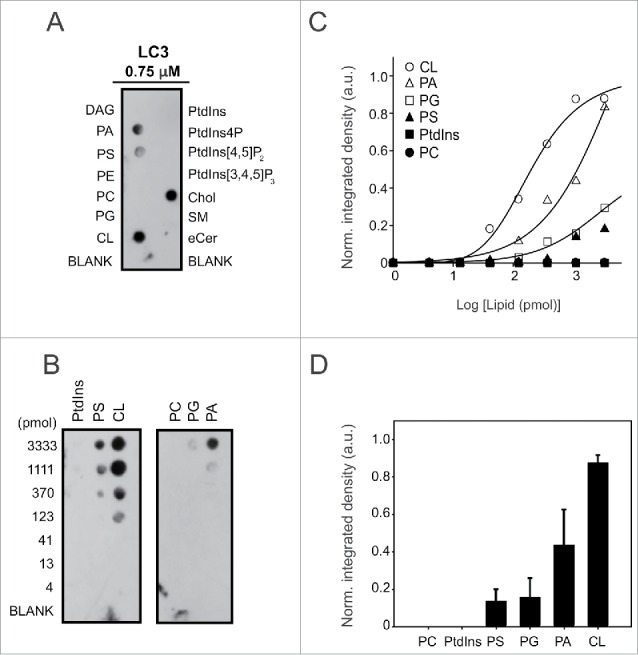
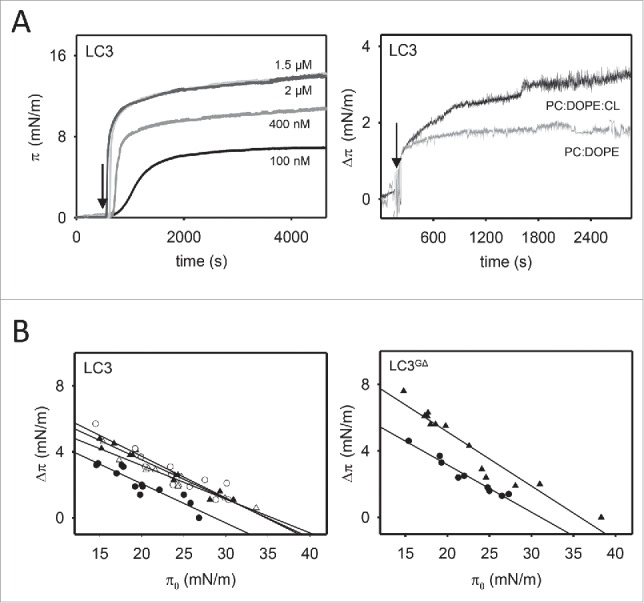
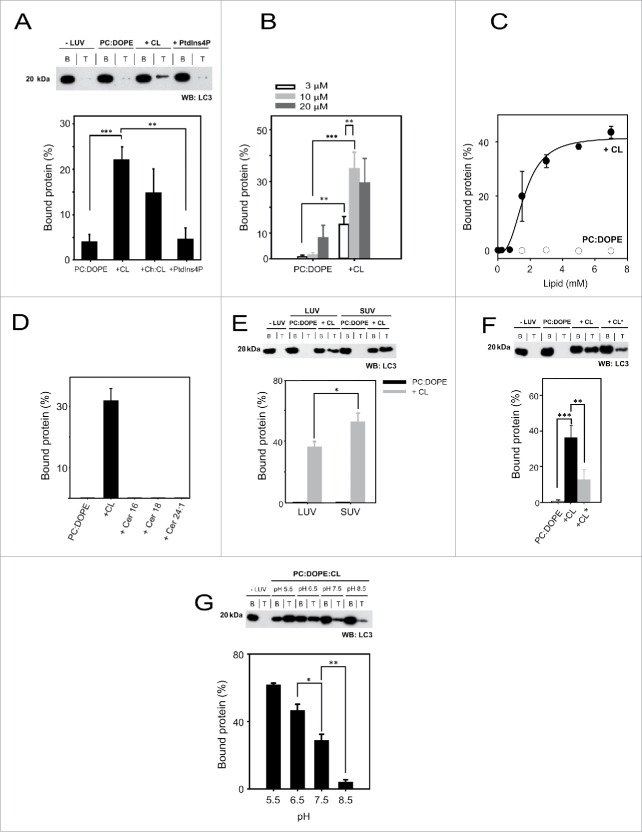
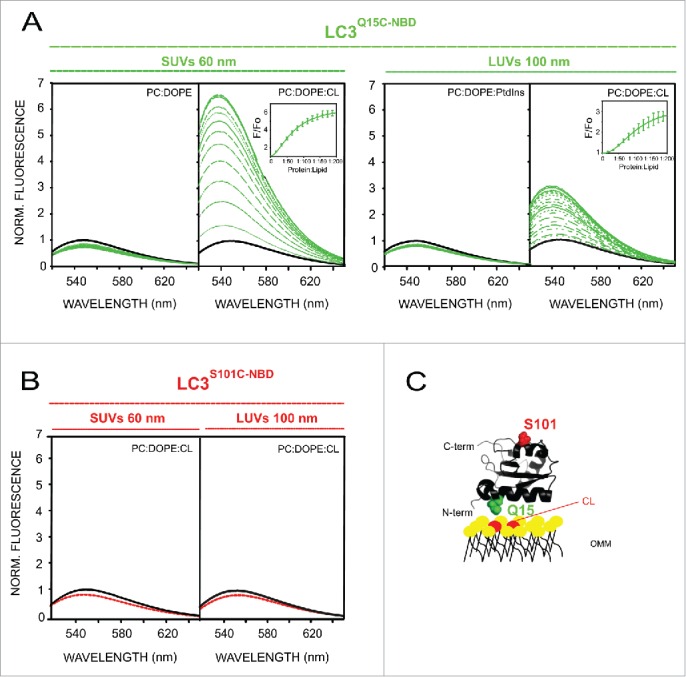
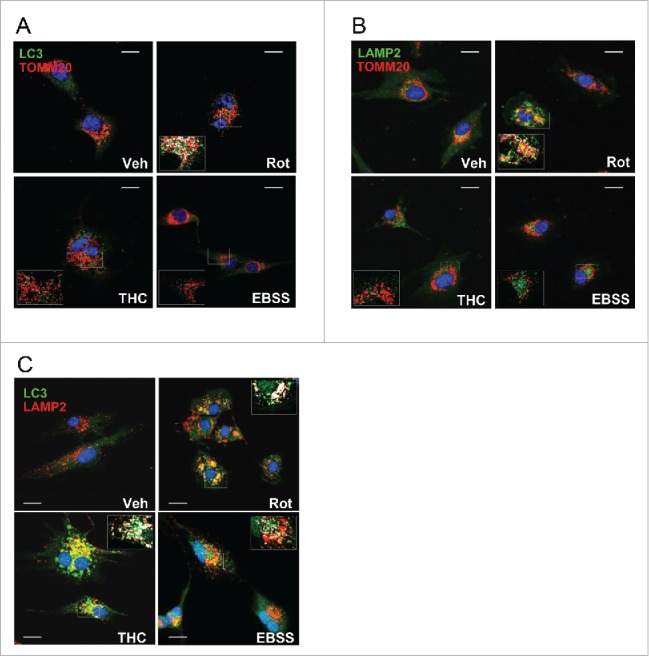
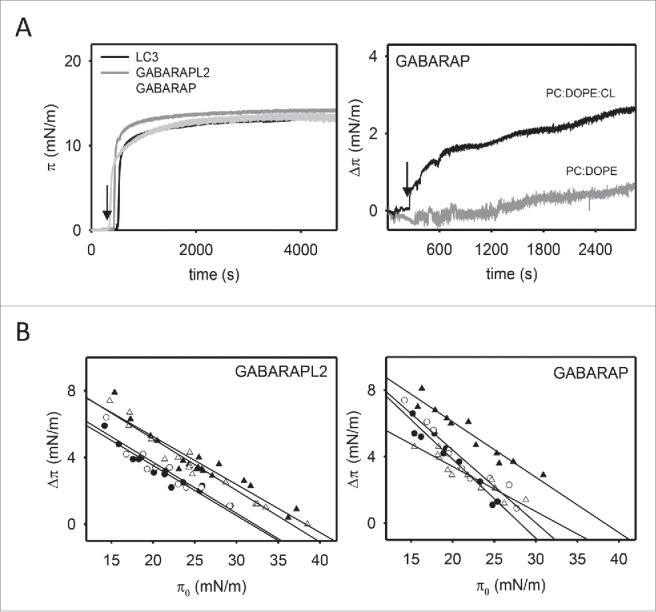
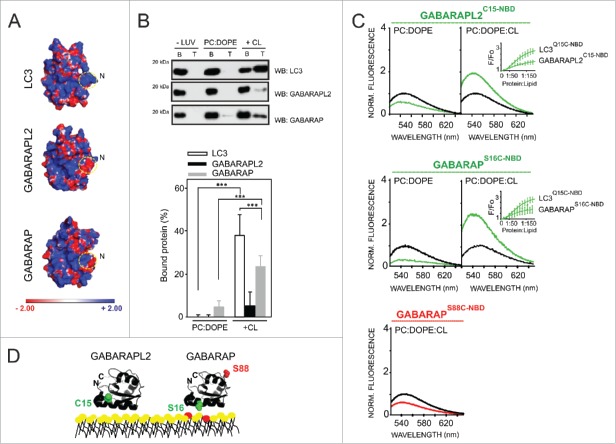
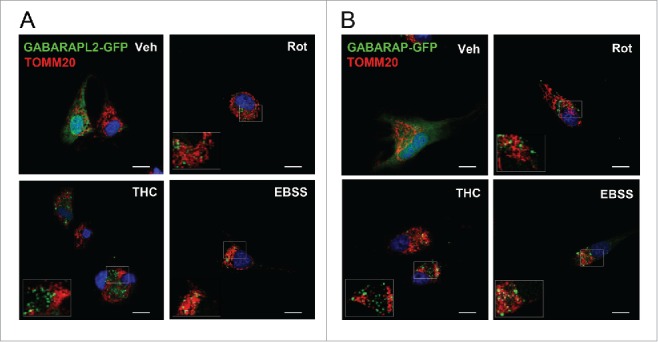
The phospholipid cardiolipin (CL) has been proposed to play a role in selective mitochondrial autophagy, or mitophagy. CL externalization to the outer mitochondrial membrane would act as a signal for the human Atg8 ortholog subfamily, MAP1LC3 (LC3). The latter would mediate both mitochondrial recognition and autophagosome formation, ultimately leading to removal of damaged mitochondria. We have applied quantitative biophysical techniques to the study of CL interaction with various Atg8 human orthologs, namely LC3B, GABARAPL2 and GABARAP. We have found that LC3B interacts preferentially with CL over other di-anionic lipids, that CL-LC3B binding occurs with positive cooperativity, and that the CL-LC3B interaction relies only partially on electrostatic forces. CL-induced increased membrane fluidity appears also as an important factor helping LC3B to bind CL. The LC3B C terminus remains exposed to the hydrophilic environment after protein binding to CL-enriched membranes. In intact U87MG human glioblastoma cells rotenone-induced autophagy leads to LC3B translocation to mitochondria and subsequent delivery of mitochondria to lysosomes. We have also observed that GABARAP, but not GABARAPL2, interacts with CL in vitro. However neither GABARAP nor GABARAPL2 were translocated to mitochondria in rotenone-treated U87MG cells. Thus the various human Atg8 orthologs might play specific roles in different autophagic processes.

Keywords: CL; GABARAP; GABARAPL2; LC3B; glioblastoma; mitophagy.


Figures

Figure 1.
Figure 1.
Human Atg8 family members. (A) Sequence alignment (Clustal Omega) of yeast Atg8, Atg8 human orthologs and ubiquitin. Highlighted in gray are the highly conserved basic amino acids, which have the potential to bind negatively charged amino acids located at the C- and N-terminal regions of the conserved LC3-interacting region (LIR; consensus: W/Y/FxxL/I/V) present in the different cargo receptors during selective autophagy. (B) View of LC3B bound to the SQSTM1 LIR-motif (PDB: 2ZJD). Highlighted in blue are the positively charged residues in LC3B that stabilize binding to SQSTM1 LIR motif. Picture was created by UCSF Chimera.
Figure 2.
Figure 2.
LC3B binds CL directly and preferentially over other anionic lipids. LC3B immunoreactivity is shown from a representative protein:lipid dot-blot experiment with some of the most common glycerolipids and sphingolipids present in mammalian cells (1 nmol of each lipid) (A) and with increasing amounts of some of those lipids (B). (C) Integrated LC3B immunoreactivity was measured at each spot and normalized for each lipid, and the data were fitted with a sigmoidal equation of the type f = (y0+a*xb)/(cb+xb), from which an apparent Hill coefficient (b) of 5.3 ± 1.2 for CL binding could be estimated (R2 = 0.991). (D) Quantitative assessment of bound LC3B (0.75 µM) with 1.11 nmol of each lipid. LC3B immunoreactivity was measured at each spot by immunoblotting using anti-LC3 antibody and densitometry. Data shown as mean ± SEM (n = 3). a.u., arbitrary units. Norm., normalized.
Figure 3.
Figure 3.
LC3B and LC3B insertion into lipid monolayers. (A) Representative time courses of LC3B adsorption at the air-water interface (left-hand panel) and representative time courses of increase in lateral pressure after LC3B (1.5 μM) insertion into PC:DOPE (80:20 mol ratio) and PC:DOPE:CL (55:20:25 mol ratio) monolayers (right-hand panel). (B) Maximum increase in lateral pressure after LC3B and LC3B insertion into lipid monolayers. Lipids were: [•] PC:DOPE (80:20 mol ratio), [▴] PC:DOPE:CL, [○] PC:DOPE:PS and [Δ] PC:DOPE:PtdIns4P (55:20:25 mol ratio). Data reported as a function of initial lateral pressure π0. Very similar results were obtained at 37°C, data not shown.
Figure 4.
Figure 4.
LC3B interacts preferentially with CL-containing liposomes. The liposome-bound protein fraction was analyzed after flotation in a sucrose density gradient by SDS-PAGE/immunoblot analysis and quantified by densitometric integration of the dots. (A) 10 µM LC3B was incubated with 3 mM LUVs composed of either PC:DOPE (80:20 mol ratio), PC:DOPE:CL (50:20:30 mol ratio), PC:DOPE:Chol:CL (30:14:33:23 mol ratio) or PC:DOPE:PtdIns4P (50:20:30 mol ratio). Molecular mass is shown in kDa on the left-hand side. Data shown as mean ± SEM (n = 3); **P = 0.001 to 0.01, ***P< 0.001. (B) LC3B dose-dependence analysis using 3, 10 and 20 µM protein and 3 mM liposomes. Data shown as mean ± SD (n = 3); **P = 0.001 to 0.01, ***P < 0.001. (C) Protein:lipid ratio effect on LC3B binding to PC:DOPE or PC:DOPE:CL vesicles. The continuous line represents the best fit of the data, assuming an EC50 (half maximal effective concentration) of 1.65 ± 0.2 mM for binding to PC:DOPE:CL vesicles. Data shown as mean ± SEM from at least 3 independent experiments. (D) 10 µM LC3B was incubated with 3 mM LUVs composed of PC:DOPE (80:20 mol ratio), PC:DOPE:CL, PC:DOPE:Cer16, PC:DOPE:Cer18 or PC:DOPE:Cer24:1 (50:20:30 mol ratio). Data shown as mean ± SEM from at least 3 independent experiments. (E) 10 µM LC3B was incubated with 3 mM LUV or SUV to analyze vesicle size effect on the interaction. Data shown as mean ± SD (n = 3); *P = 0.01 to 0.05. (F) Comparison between heart bovine (CL) and E. coli (CL*) cardiolipins in the interaction. 10 µM LC3B was incubated with 3 mM LUV of either composition. Data shown as mean ± SD (n = 3); **P = 0.001 to 0.01, ***P < 0.001. (G) Effect of pH on LC3B (10 μM) binding to PC:DOPE:CL large vesicles (3 mM). Data shown as mean ± SEM (n = 3); *P = 0.01 to 0.05, **P = 0.001 to 0.01.
Figure 5.
Figure 5.
LC3B C terminus remains exposed to the hydrophilic environment after protein binding to CL-enriched membranes. Representative NBD fluorescence emission spectra of (A) LC3BQ15C-NBD (1 µM) in the absence or presence of increasing amounts of liposomes containing either PC:DOPE (80:20 mol ratio), PC:DOPE:CL or PC:DOPE: PtdIns (50:20:30 mol ratio); and (B) LC3BS101C-NBD (1 μM) in the absence or presence of PC:DOPE:CL liposomes. In each case, fluorescence was normalized to the peak intensity of the protein spectrum in the absence of liposomes. (C) Structural model generated with PyMol depicting the 2 LC3B residues that were individually mutated to cysteine obtaining single-cysteine LC3B mutants. The environmentally sensitive fluorophore NBD was used to label each of these single cysteine residues. PDB: 1UGM. OMM, outer mitochondrial membrane. Norm., normalized.
Figure 6.
Figure 6.
Rotenone, but not THC or nutrient starvation, elicits mitophagy in U87MG human glioblastoma cells. (A) Analysis of endogenous LC3B puncta colocalization with TOMM20-stained mitochondria in response to rotenone (Rot) (1 μM; 4 h) or THC (4 μM; 6 h) treatments, or to nutrient deprivation (EBSS) conditions in U87MG cells. (B) Rotenone, but not THC or EBSS, increased delivery of TOMM20-stained mitochondria to LAMP2-stained lysosomes in U87MG cells. (C) LC3B puncta colocalization with lysosomes (LAMP2) in response to rotenone (Rot) (1 μM; 4 h) or THC (4 μM; 6 h) treatments, or to nutrient deprivation (EBSS) conditions in U87MG cells. Bar: 20 µm. Veh, vehicle.
Figure 7.
Figure 7.
GABARAPL2 and GABARAP insertion into lipid monolayers. (A) Representative time courses of adsorption of LC3B, GABARAPL2 and GABARAP (1.5 µM) at the air-water interface (left-hand panel) and representative time courses of increase in lateral pressure after GABARAP (1.5 μM) insertion into PC:DOPE (80:20 mol ratio) or PC:DOPE:CL (55:20:25 mol ratio) monolayers (right-hand panel). (B) Maximum increase in lateral pressure after GABARAPL2 and GABARAP insertion into lipid monolayers. Lipids were: [•] PC:DOPE (80:20 mol ratio), [▴] PC:DOPE:CL, [○] PC:DOPE:PS and [Δ] PC:DOPE:PtdIns4P (55:20:25 mol ratio). Data reported as a function of initial lateral pressure π0. Very similar results were obtained at 37°C, data not shown.
Figure 8.
Figure 8.
Different CL-interacting properties among human Atg8 orthologs. (A) Electrostatic potential surface of each LC3 ortholog in solution, calculated using the Poisson-Boltzmann equation and displayed with PyMOL. PDB: 1UGM (LC3), 1EO6 (GABARAPL2), 1GNU (GABARAP). (B) Each ortholog (10 µM) was incubated with 3 mM LUVs composed of PC:DOPE (80:20 mol ratio) or PC:DOPE:CL (50:20:30 mol ratio) followed by flotation of the liposomes by gradient centrifugation. Bound protein fraction was quantified by SDS-PAGE/immunoblot analysis using anti-LC3, GABARAPL2 and GABARAP antibodies. Molecular masses are shown in kDa on the left-hand side. Data shown as mean ± SD (n ≥ 3); ***P< 0.001. (C) Representative NBD fluorescence emission spectra of GABARAPL2C15-NBD and GABARAPS16C-NBD (1 µM) in the absence or presence of increasing amounts of liposomes containing PC:DOPE (80:20 mol ratio) or PC:DOPE:CL (50:20:30 mol ratio); and GABARAPS88C-NBD (1 μM) in the absence or presence of PC:DOPE:CL liposomes. In each case, fluorescence was normalized to the peak intensity of the protein spectrum in the absence of liposomes. (D) A structural model generated with PyMol is also shown depicting the 2 GABARAP residues that were individually mutated to cysteine obtaining single-cysteine GABARAP mutants and the endogenous cysteine of GABARAPL2. The environmentally sensitive fluorophore NBD was used to label each of these single cysteine residues. PDB: 1EO6 (GABARAPL2), 1GNU (GABARAP). CL is colored in red. Norm, normalized.
Figure 9.
Figure 9.
GABARAPL2 and GABARAP do not exhibit mitochondrial colocalization after rotenone treatment in U87MG cells. (A-B) Analysis of GABARAPL2-GFP or GABARAP-GFP puncta colocalization with TOMM20-stained mitochondria in response to rotenone (1 μM; 4 h) or THC (4 μM; 6 h) treatments, or to nutrient deprivation conditions in U87MG cells. Bar: 20 µm. Veh, vehicle.

References

    1. Mizushima N, Komatsu M. Autophagy: Renovation of cells and tissues. Cell 2015; 147:728-41; http://dx.doi.org/10.1016/j.cell.2011.10.026 - DOI - PubMed
    1. Shibutani ST, Yoshimori T. A current perspective of autophagosome biogenesis. Cell Res 2014; 24:58-68; PMID:24296784; http://dx.doi.org/10.1038/cr.2013.159 - DOI - PMC - PubMed
    1. Reggiori F, Komatsu M, Finley K, Simonsen A. Autophagy: More than a nonselective pathway. Int J Cell Biol 2012; 2012:219625. - PMC - PubMed
    1. Youle RJ, Narendra DP. Mechanisms of mitophagy. Nat Rev Mol Cell Biol 2011; 12:9-14; PMID:21179058; http://dx.doi.org/10.1038/nrm3028 - DOI - PMC - PubMed
    1. Ashrafi G, Schwarz TL The pathways of mitophagy for quality control and clearance of mitochondria. Cell Death Differentiation 2013; 20(1):31-42; PMID:22743996; http://dx.doi.org/1716684710.1038/cdd.2012.81 - DOI - PMC - PubMed

MeSH terms