. 2017 Feb;13(2):423-441.
doi: 10.1080/15548627.2016.1241922. Epub 2016 Oct 20.

MIR144* inhibits antimicrobial responses against Mycobacterium tuberculosis in human monocytes and macrophages by targeting the autophagy protein DRAM2

Affiliations

MIR144* inhibits antimicrobial responses against Mycobacterium tuberculosis in human monocytes and macrophages by targeting the autophagy protein DRAM2

Jin Kyung Kim et al. Autophagy. 2017 Feb.

Abstract

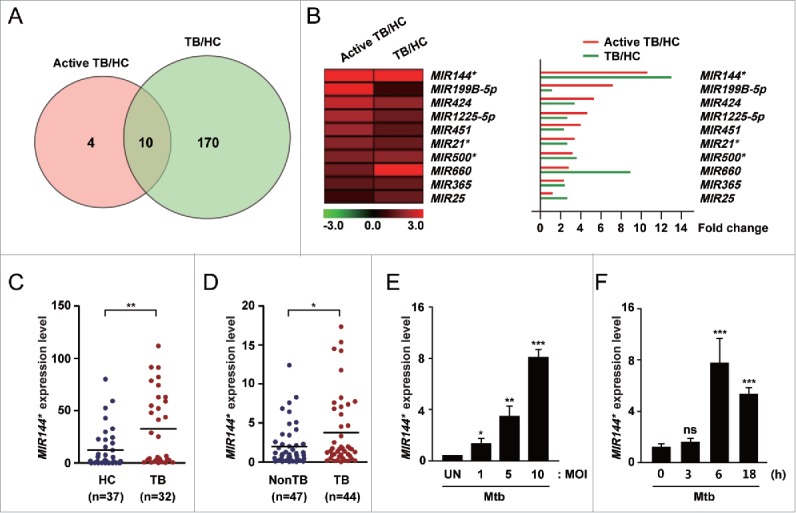
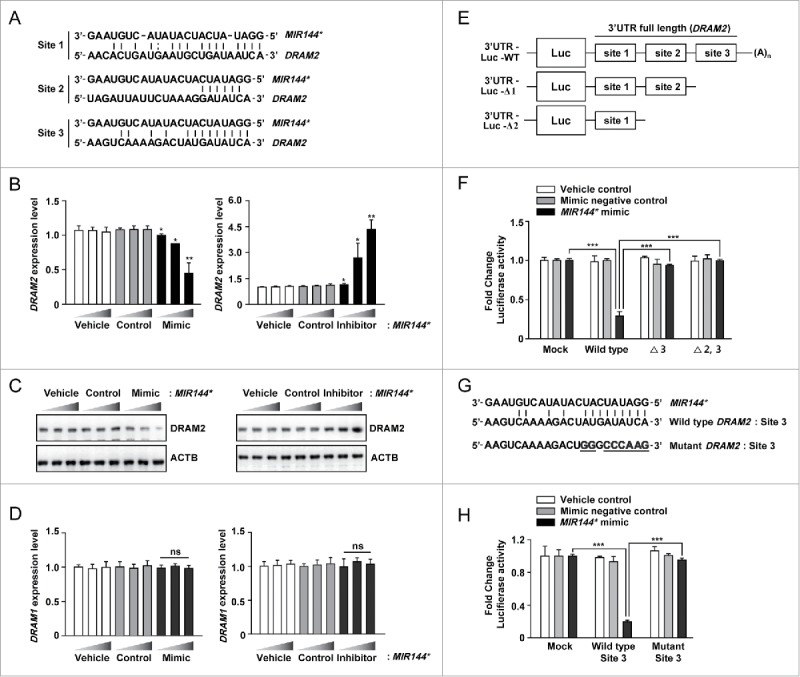
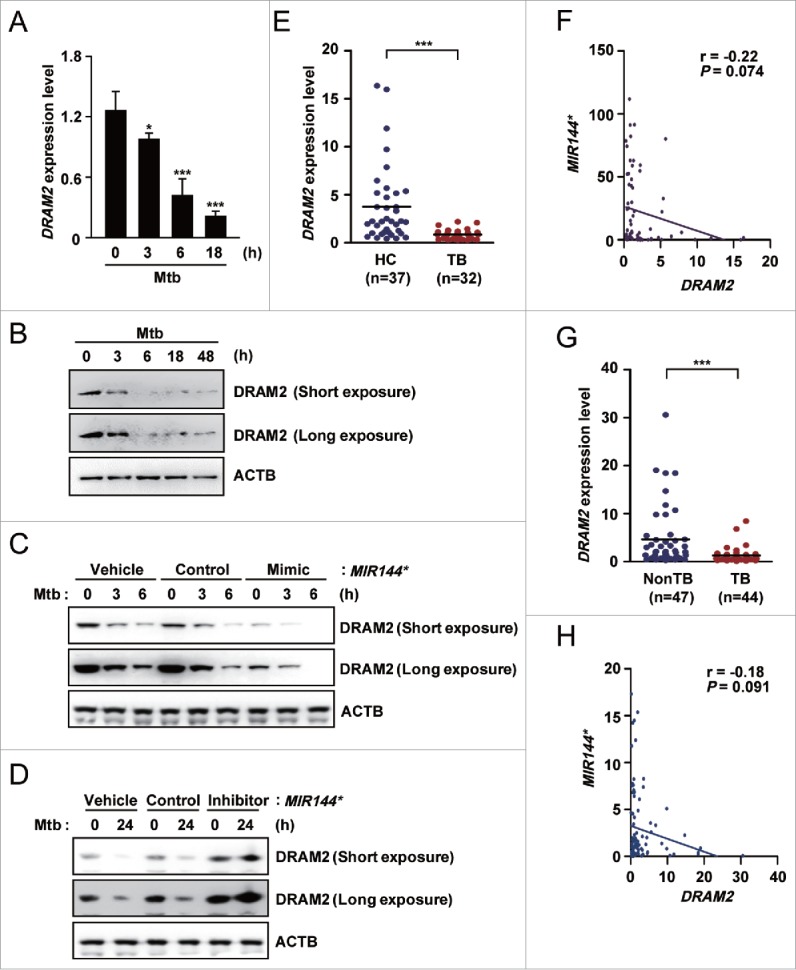
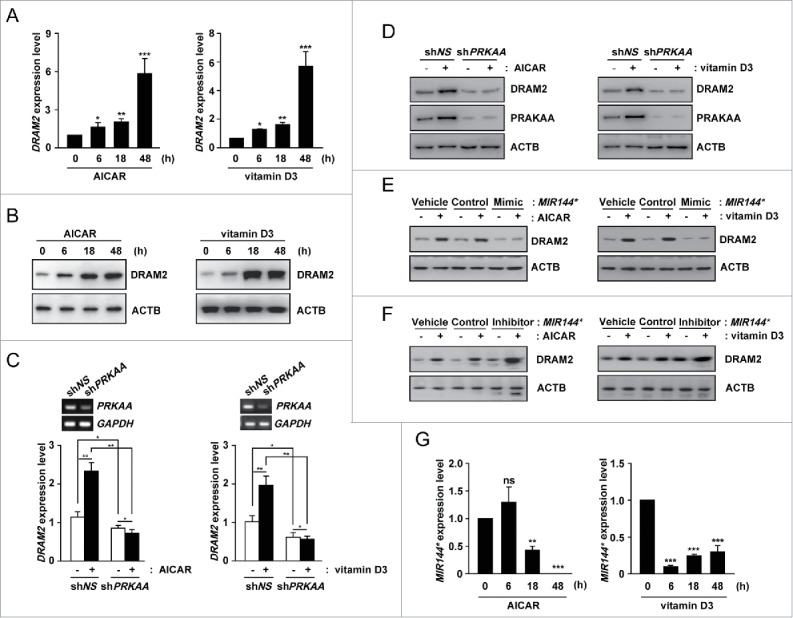
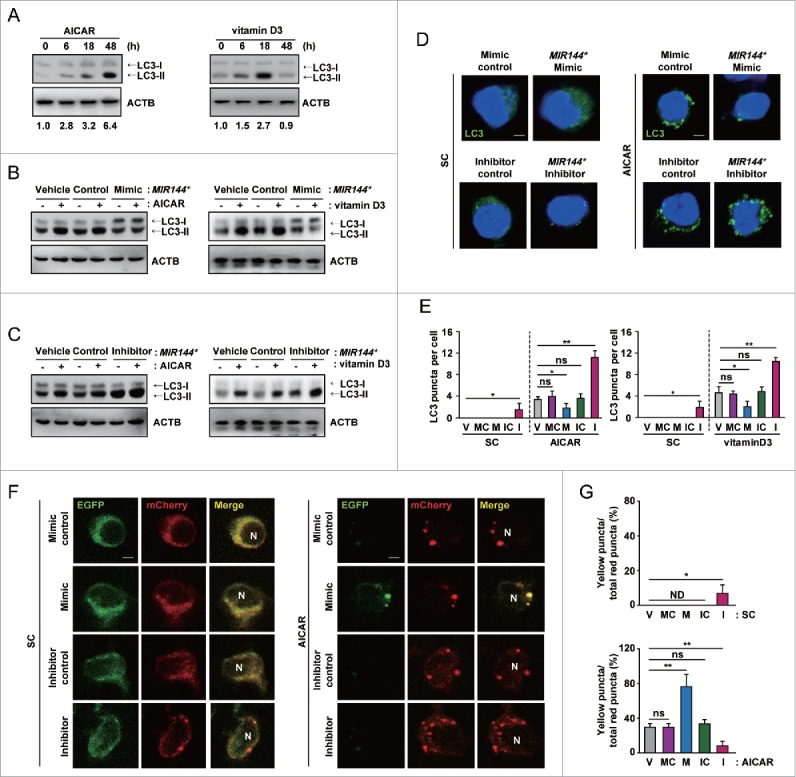
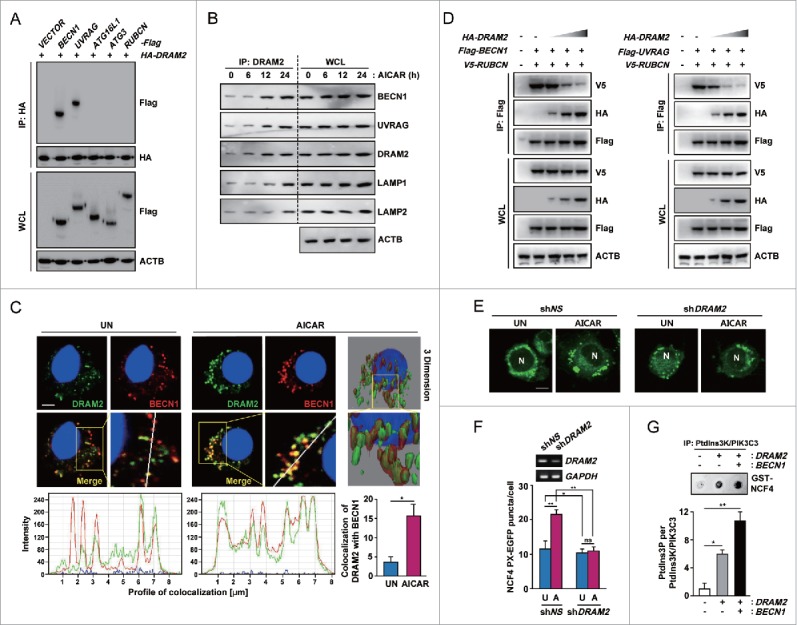
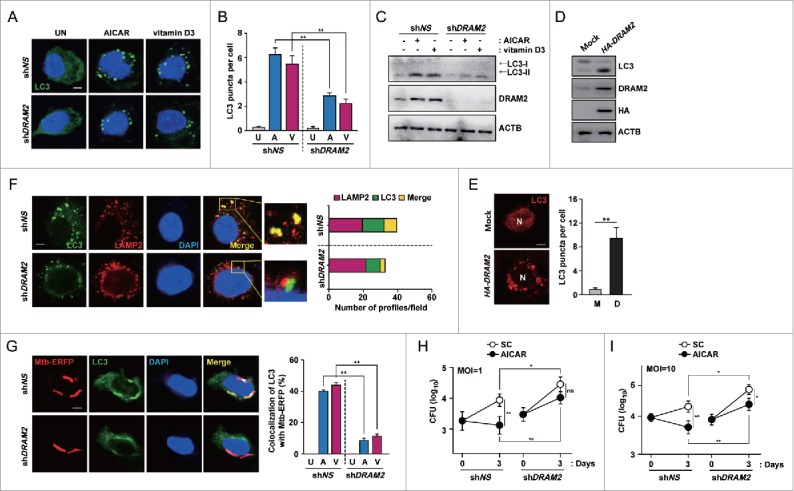
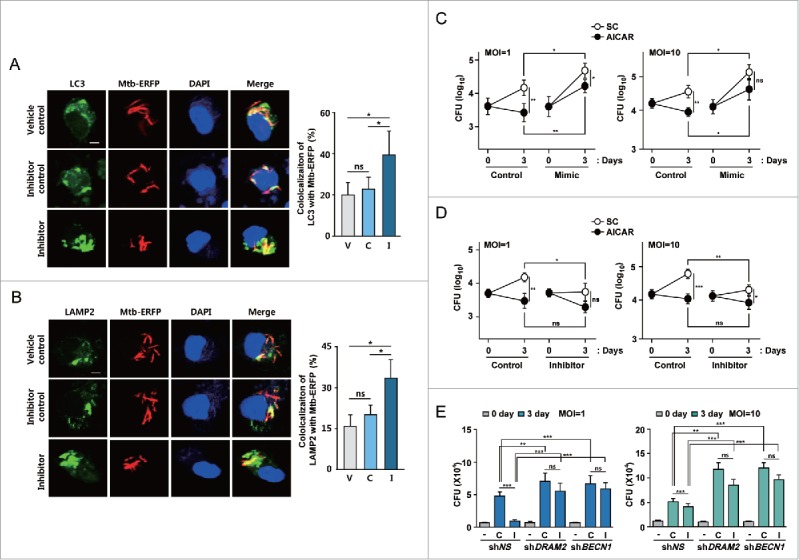
Autophagy is an important antimicrobial effector process that defends against Mycobacterium tuberculosis (Mtb), the human pathogen causing tuberculosis (TB). MicroRNAs (miRNAs), endogenous noncoding RNAs, are involved in various biological functions and act as post-transcriptional regulators to target mRNAs. The process by which miRNAs affect antibacterial autophagy and host defense mechanisms against Mtb infections in human monocytes and macrophages is largely uncharacterized. In this study, we show that Mtb significantly induces the expression of MIR144*/hsa-miR-144-5p, which targets the 3'-untranslated region of DRAM2 (DNA damage regulated autophagy modulator 2) in human monocytes and macrophages. Mtb infection downregulated, whereas the autophagy activators upregulated, DRAM2 expression in human monocytes and macrophages by activating AMP-activated protein kinase. In addition, overexpression of MIR144* decreased DRAM2 expression and formation of autophagosomes in human monocytes, whereas inhibition of MIR144* had the opposite effect. Moreover, the levels of MIR144* were elevated, whereas DRAM2 levels were reduced, in human peripheral blood cells and tissues in TB patients, indicating the clinical significance of MIR144* and DRAM2 in human TB. Notably, DRAM2 interacted with BECN1 and UVRAG, essential components of the autophagic machinery, leading to displacement of RUBCN from the BECN1 complex and enhancement of Ptdlns3K activity. Furthermore, MIR144* and DRAM2 were critically involved in phagosomal maturation and enhanced antimicrobial effects against Mtb. Our findings identify a previously unrecognized role of human MIR144* in the inhibition of antibacterial autophagy and the innate host immune response to Mtb. Additionally, these data reveal that DRAM2 is a key coordinator of autophagy activation that enhances antimicrobial activity against Mtb.

Keywords: AMPK; DRAM2; MIR144*; Mycobacterium tuberculosis; tuberculosis.


Figures

Figure 1.
Figure 1.
Mtb infection upregulates the expression of MIR144* in human MDMs and in TB patients. (A) Venn diagram showing the distribution of differentially upregulated miRNAs between TB patients and healthy controls (HCs) from the GEO public databases (GSE 29190 and GSE34608). (B) (Left) Heatmap analysis displaying raw data. (Right) Fold change was calculated by dividing the average signal intensity of TB patients by that of HCs. (C) Human PBMCs were isolated from HCs (n = 37) and TB patients (n = 32). Expression levels of MIR144* were determined by real-time PCR. (D) Real-time PCR analysis of MIR144* expression in disease sites from nonTB controls (NonTB; n = 47) and from pulmonary and extrapulmonary TB patients (TB; n = 44). (E and F) Human MDMs were infected with Mtb at the indicated MOIs for 6 h (E) or at an MOI of 10 for the indicated times (F). Experiments were performed 3 times and data are presented as means ± SD. *P < 0.05, **P < 0.01 and ***P < 0.001, compared with the uninfected control (E and F). UN, uninfected control; TB, tuberculosis; HCs, healthy controls; ns, not significant.
Figure 2.
Figure 2.
DRAM2 is a target of MIR144*. (A) Three MIR144* binding sequences located in the DRAM2 3′ UTR. (B) Human primary monocytes were transfected with vehicle control; mimic negative control or MIR144* mimic (10, 20, and 50 nM); inhibitor negative control or MIR144* inhibitor (50, 100, and 150 nM) for 24 h. Expression levels of DRAM2 were determined by real-time PCR. (C) Human primary monocytes were transfected with vehicle control; mimic negative control (50 nM) or MIR144* mimic (10, 20, and 50 nM); inhibitor negative control (150 nM) or MIR144* inhibitor (50, 100, and 150 nM) for 24 h. DRAM2 protein levels were determined by immunoblotting. (D) Human primary monocytes were transfected with vehicle control; mimic negative control or MIR144* mimic (10, 20, and 50 nM); inhibitor negative control or MIR144* inhibitor (50, 100, and 150 nM) for 24 h. Expression levels of DRAM1 were determined by real-time PCR. (E) Schematic representation of the 3 MIR144*-binding sites in the DRAM2 3′ UTR construct (full length; WT, wild type) and generation of deletion constructs (Δ3, deletion of site 3; Δ2,3, deletion of sites 2 and 3). (F) THP-1 cells were cotransfected with vehicle control, mimic negative control, or MIR144* mimic (50 nM) and a series of luciferase reporter constructs (pmirGLO vector (mock), wild type, Δ3 and Δ2,3), which were incubated for 24 h. Luciferase assays were conducted to assess MIR144* targeting of the DRAM2 3′ UTR. (G) Nucleotide alignments among the MIR144* seed sequence, site 3, and mutated sequences 3′ UTR of DRAM2 cloned into pmirGLO vectors. (H) THP-1 cells were cotransfected with pmirGLO vector (mock) carrying site 3 or mutant constructs in addition to the vehicle control, mimic negative control, or MIR144* mimic (50 nM). Following cotransfection, luciferase assays were performed. Experiments were performed 3 times, and data were presented as means ± SD. *P < 0.05, **P < 0.01 and ***P < 0.001, compared with the vehicle control (B and D). ns, not significant.
Figure 3.
Figure 3.
DRAM2 expression is downregulated by Mtb infection in human macrophages and in disease samples from tuberculosis patients. (A and B) Human MDMs infected with Mtb (MOI of 10) for the indicated times. (A) DRAM2 mRNA levels were determined by real-time PCR. (B) DRAM2 protein levels were evaluated by immunoblotting. (C and D) Human MDMs were transfected with vehicle control; mimic negative control or MIR144* mimic (50 nM for C); inhibitor negative control or MIR144* inhibitor (150 nM for D) for 24 h and then infected with Mtb for 3, 6 (C) or 24 h (D). DRAM2 protein levels were then determined by immunoblotting. (E) Human PBMCs were isolated from HCs (n = 37) and TB patients (n = 32). Expression levels of DRAM2 were determined by real-time PCR. (F) Correlation of the expression of MIR144* and DRAM2 by Pearson regression in PBMCs from HCs and TB patients (Pearson r = −0.22, P = 0.074). (G) Real-time PCR analysis of DRAM2 expression in disease sites from nonTB controls (NonTB; n = 47) and disease sites from pulmonary and extrapulmonary TB patients (TB; n = 44). (H) Correlation of MIR144* and DRAM2 expression by Pearson regression in tissues from HCs and TB patients (Pearson r = −0.18, P = 0.091). Experiments were performed 3 times, and data are presented as means ± SD. *P < 0.05 and ***P < 0.001, compared with untreated control (A). TB, tuberculosis patients; HCs, healthy controls.
Figure 4.
Figure 4.
Autophagy activators upregulate and MIR144* downregulates DRAM2 levels in human primary monocytes. (A and B) Human primary monocytes were treated with AICAR (0.5 mM) or vitamin D3 (20 nM) for the indicated times. (A) DRAM2 mRNA levels were determined by real-time PCR. (B) DRAM2 protein levels were examined by immunoblotting. (C and D) Human primary monocytes were transduced with lentivirus expressing nonspecific shRNA (shNS) or shRNA specific for PRKAA1/2 (shPRKAA) using polybrene (8 μg/ml). After 36 h, human primary monocytes were treated with or without AICAR (0.5 mM) or vitamin D3 (20 nM). (C) (Top) Semiquantitative PCR analysis was performed to assess transduction efficiency. (Bottom) DRAM2 mRNA levels were determined by real-time PCR. (D) DRAM2 protein levels were evaluated by immunoblotting. (E and F) Human primary monocytes were transfected with vehicle control; mimic negative control or MIR144* mimic (50 nM for E); inhibitor negative control or MIR144* inhibitor (150 nM for F) for 24 h and then treated with or without AICAR (0.5 mM) or vitamin D3 (20 nM). DRAM2 protein levels were examined by immunoblotting. (G) Human primary monocytes were treated with AICAR (0.5 mM) or vitamin D3 (20 nM) for the indicated times. Expression levels of MIR144* were determined by real-time PCR. Experiments were performed 3 times, and data are presented as means ± SD. *P < 0.05, **P < 0.01 and ***P < 0.001, compared with the untreated control (A, G). ns, not significant.
Figure 5.
Figure 5.
MIR144* inhibits autophagy induction and autophagic flux in human primary monocytes. (A) Human primary monocytes were treated with AICAR (0.5 mM) or vitamin D3 (20 nM) for the indicated times. (B and C) Human primary monocytes were transfected with vehicle control; mimic negative control or MIR144* mimic (50 nM for B); inhibitor negative control or MIR144* inhibitor (150 nM for C) for 24 h and then treated with AICAR (0.5 mM) or vitamin D3 (20 nM) for 24 h. (A to C) LC3 protein levels were determined by immunoblotting. (D) Human primary monocytes were transfected with mimic negative control or MIR144* mimic (50 nM); inhibitor negative control or MIR144* inhibitor (150 nM) for 24 h following treatment without (left) or with AICAR (0.5 mM) (right) for 24 h and then fixed and stained with anti-LC3 (Alexa Fluor 488; green) to detect LC3 punctate. Scale bars: 5 μm. (E) Quantitative data of LC3 punctate analysis. (F) Human monocytes were transduced with a retrovirus expressing a tandem LC3B plasmid (mCherry-EGFP-LC3B) for 24 h. Cells were then transfected with mimic negative control or MIR144* mimic (50 nM); inhibitor negative control or MIR144* inhibitor (150 nM) for 24 h, followed by treatment without (left) or with AICAR (0.5 mM) (right) for 24 h. Cells were fixed, and LC3 was analyzed by confocal microscopy. Scale bars: 5 μm. (G) Quantification of yellow puncta/total red puncta (%) per cell. Experiments were performed 3 times, and data are presented as means ± SD. *P < 0.05 and **P < 0.01. V, vehicle control; MC, mimic negative control; M, MIR144* mimic; IC, inhibitor negative control; I, MIR144* inhibitor; N, nucleus; ns, not significant; SC, solvent control; ND, not detected.
Figure 6.
Figure 6.
DRAM2 interacts with essential autophagy proteins including BECN1 and UVRAG. (A) 293T cells were cotransfected with HA-DRAM2 and Flag version of BECN1, UVRAG, ATG16L1, ATG3 or RUBCN. After 48 h, cells were subjected to immunoprecipitation with an anti-HA, followed by immunoblotting using an anti-Flag. WCLs were used for immunoblotting with anti-HA, anti-Flag or anti-ACTB. (B) Human monocytes were incubated with AICAR (0.5 mM) for the indicated times and subjected to immunoprecipitation with an anti-DRAM2, followed by immunoblotting with anti-BECN1, anti-UVRAG, anti-DRAM2, anti-LAMP1, anti-LAMP2 and anti-ACTB. (C) Human monocytes were treated without or with AICAR (0.5 mM) for 24 h. (Top) Cells were stained with anti-DRAM2 (Alexa Fluor 488; green) and anti-BECN1 (Alexa Fluor 594; red). Cells were visualized by confocal microscopy and 3-dimensional image analysis. (Bottom) Quantitative data (right) and tracing of DRAM2 and BECN1 colocalization (left). Scale bars: 2 μm. (D) 293T cells were cotransfected with Flag-BECN1 and V5-RUBCN (Left) or Flag-UVRAG and V5-RUBCN (Right), together with increasing amounts of HA-DRAM2, and subjected to IP using an antibody for Flag, followed by immunoblotting analysis with antibodies for V5, HA, Flag, and ACTB. (E) THP-1 cells were transduced with lentivirus expressing shNS or shDRAM2 using polybrene (8 μg/ml). After 36 h, cells were transfected with the NCF4 PX-EGFP plasmid for 24 h and then incubated with or without AICAR (0.5 mM) for 24 h. NCF4 PX-EGFP puncta formation was analyzed by confocal microscopy. Scale bars: 5 μm. (F) (Top) Semiquantitative PCR analysis was performed to assess transduction efficiency. (Bottom) Quantitation of the number of NCF4 PX-EGFP puncta per cell. (G) (Top) A representative image of the in vitro kinase assay. THP-1 cells were cotransfected with the empty vector, HA-DRAM2, together with the Flag-BECN1 construct. An in vitro kinase assay was conducted as described in Materials and Methods. (Bottom) Graph representation of 2 independent experiments. Experiments were performed 3 times, and data are presented as means ± SD. *P < 0.05 and **P < 0.01. WCL, whole-cell lysate; N, nucleus; UN, untreated control (C and E); U, untreated control (F); A, AICAR; ns, not significant.
Figure 7.
Figure 7.
DRAM2 activates autophagy induction and maturation in response to autophagy activators. (A to C) Human primary monocytes were transduced with lentivirus expressing shNS or shDRAM2 using polybrene (8 μg/ml). After 36 h, cells were treated with AICAR (0.5 mM) or vitamin D3 (20 nM) for 24 h. (A) Cells were fixed and stained with anti-LC3 (Alexa Fluor 488; green) to detect LC3 puncta. Scale bars: 5 μm. (B) Quantitative data from LC3 puncta analysis. (C) LC3 protein levels were determined by immunoblotting. (D and E) THP-1 cells were transfected with the pIRES control vector (mock) or DRAM2-HA plasmid. LC3 protein levels were determined by immunoblotting (D), and LC3 puncta were visualized by confocal microscopy (E, Left) and quantitative analysis (E, Right). (F) Human primary monocytes were transduced with lentivirus expressing shNS or shDRAM2 using polybrene (8 μg/ml). (Left) After 36 h, cells were incubated with AICAR (0.5 mM) for 24 h and stained using anti-LC3 (Alexa Fluor 488; green) and anti-LAMP2 (Alexa Fluor 594; red) antibodies. (Right) The number of profiles in each field. Scale bars: 5 μm. (G) Human primary monocytes were transduced with lentivirus expressing shNS or shDRAM2 using polybrene (8 μg/ml). (Left) After 36 h, cells were infected with Mtb-ERFP for 4 h and then treated with AICAR (0.5 mM) for 24 h. (Left) Cells were fixed, stained with anti-LC3 (Alexa Fluor 488; green), and assayed for the colocalization of Mtb-ERFP with LC3 by confocal microscopy. (Right) Quantitative analysis of colocalization of Mtb-ERFP with LC3. Scale bars: 5 μm. (H and I) Human MDMs were transduced with lentivirus expressing shNS or shDRAM2 using polybrene (8 μg/ml). After 36 h, cells were infected with Mtb, followed by treatment with AICAR (0.5 mM). Intracellular survival of Mtb was determined by CFU assay. Experiments were performed 3 times, and data are presented as means ± SD. *P < 0.05 and **P < 0.01. U, untreated control; A, AICAR; V, vitamin D3; M, mock vector; D, DRAM2-HA plasmid; SC, solvent control; N, nucleus; ns, not significant.
Figure 8.
Figure 8.
MIR144* is essential for phagosomal maturation and antimicrobial responses against Mtb infection. (A and B) Human MDMs were transfected with vehicle control, inhibitor negative control or MIR144* inhibitor (150 nM) for 24 h and then infected with Mtb-ERFP for 4 h. Cells were then stained with anti-LC3 (for A; Alexa Fluor 488; green) or anti-LAMP2 (for B; Alexa Fluor 488; green). Colocalization of Mtb-ERFP with anti-LC3 (for A) or anti-LAMP2 (for B) was evaluated by confocal microscopy. The image is a representative of at least 3 independent experiments (Left). Scale bar: 5 μm. Quantitative analysis of Mtb-ERFP colocalization with LC3 and LAMP2 (Right A and B, respectively). (C and D) Human MDMs were transfected with mimic negative control or MIR144* mimic (50 nM for C); inhibitor negative control or MIR144* inhibitor (150 nM for D) for 24 h. Cells were infected with Mtb (MOI of 1 or 10), followed by treatment without or with AICAR (0.5 mM). Intracellular survival of Mtb was determined by CFU assay. (E) Human MDMs were transduced with shNS, shDRAM2 or shBECN1 using polybrene (8 μM) for 36 h and then transfected with MIR144* inhibitor (150 nM) for 24 h. Cells were then infected with Mtb (MOI of 1 or 10), and intracellular survival of Mtb was determined by CFU assay. Experiments were performed 3 times, and data are presented as means ± SD. *P < 0.05, **P < 0.01, and ***P < 0.001. V, vehicle control; C, inhibitor negative control; I, MIR144* inhibitor; ns, not significant; SC, solvent control.

Similar articles

Cited by

References

    1. Deretic V. Autophagy in immunity and cell-autonomous defense against intracellular microbes. Immunol Rev 2011; 240:92-104; PMID:21349088; http://dx.doi.org/10.1111/j.1600-065X.2010.00995.x - DOI - PMC - PubMed
    1. Levine B, Mizushima N, Virgin HW. Autophagy in immunity and inflammation. Nature 2011; 469:323-35; PMID:21248839; http://dx.doi.org/10.1038/nature09782 - DOI - PMC - PubMed
    1. Cemma M, Brumell JH. Interactions of pathogenic bacteria with autophagy systems. Curr Biol 2012; 22:R540-5; PMID:22790007; http://dx.doi.org/10.1016/j.cub.2012.06.001 - DOI - PubMed
    1. Deretic V. Autophagy, an immunologic magic bullet: Mycobacterium tuberculosis phagosome maturation block and how to bypass it. Future Microbiol 2008; 3:517-24; PMID:18811236; http://dx.doi.org/10.2217/17460913.3.5.517 - DOI - PMC - PubMed
    1. Manzanillo PS, Ayres JS, Watson RO, Collins AC, Souza G, Rae CS, Schneider DS, Nakamura K, Shiloh MU, Cox JS. The ubiquitin ligase parkin mediates resistance to intracellular pathogens. Nature 2013; 501:512-6; PMID:24005326; http://dx.doi.org/10.1038/nature12566 - DOI - PMC - PubMed

MeSH terms