. 2016 Oct 19;92(2):342-357.
doi: 10.1016/j.neuron.2016.10.001.

In Situ Transcription Profiling of Single Cells Reveals Spatial Organization of Cells in the Mouse Hippocampus

Affiliations

In Situ Transcription Profiling of Single Cells Reveals Spatial Organization of Cells in the Mouse Hippocampus

Sheel Shah et al. Neuron. .

Abstract

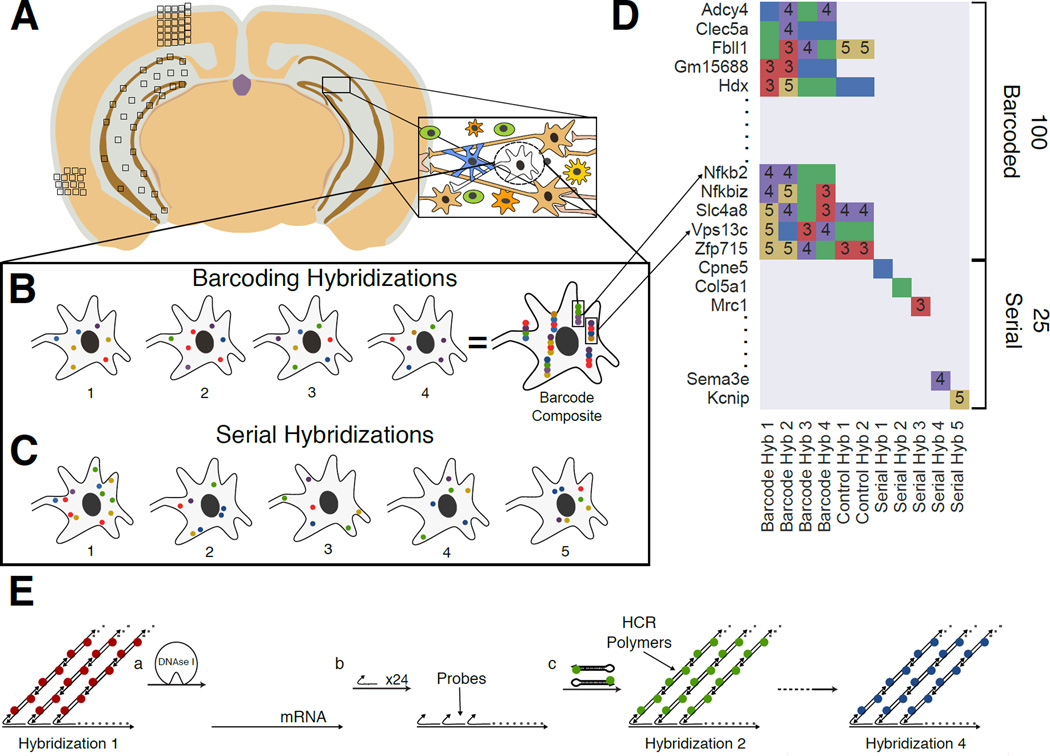
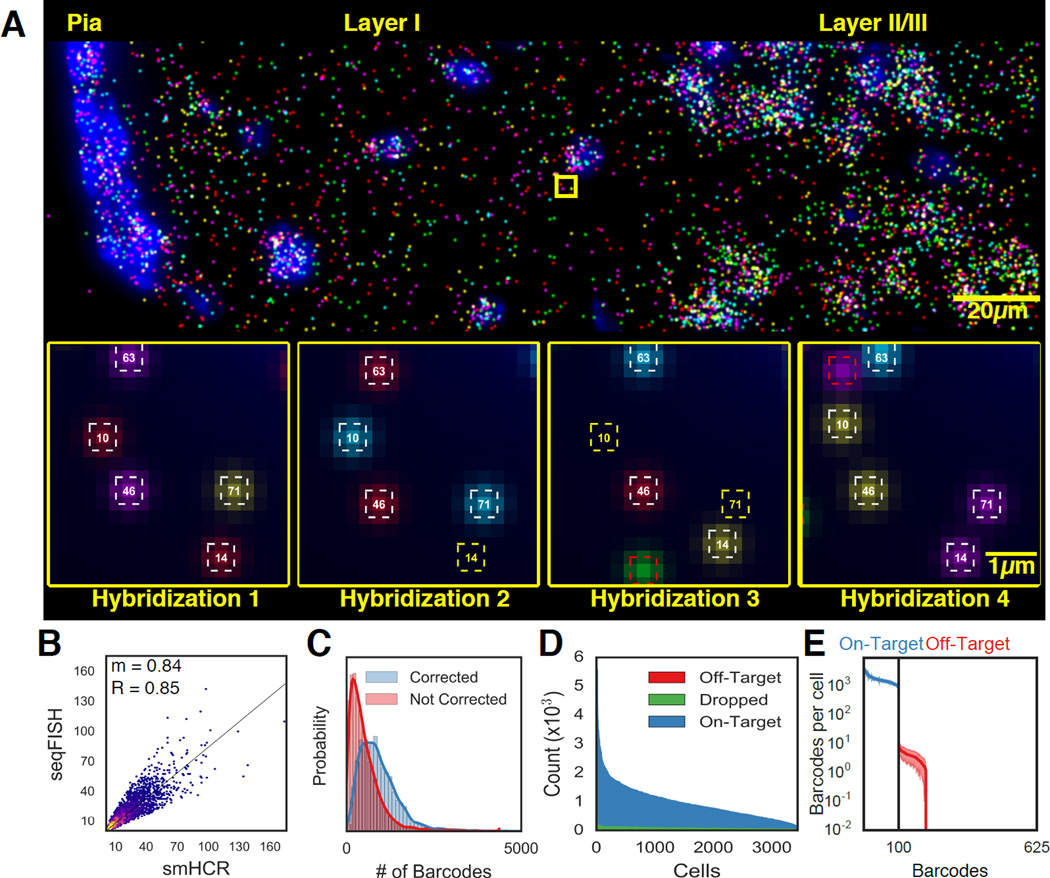
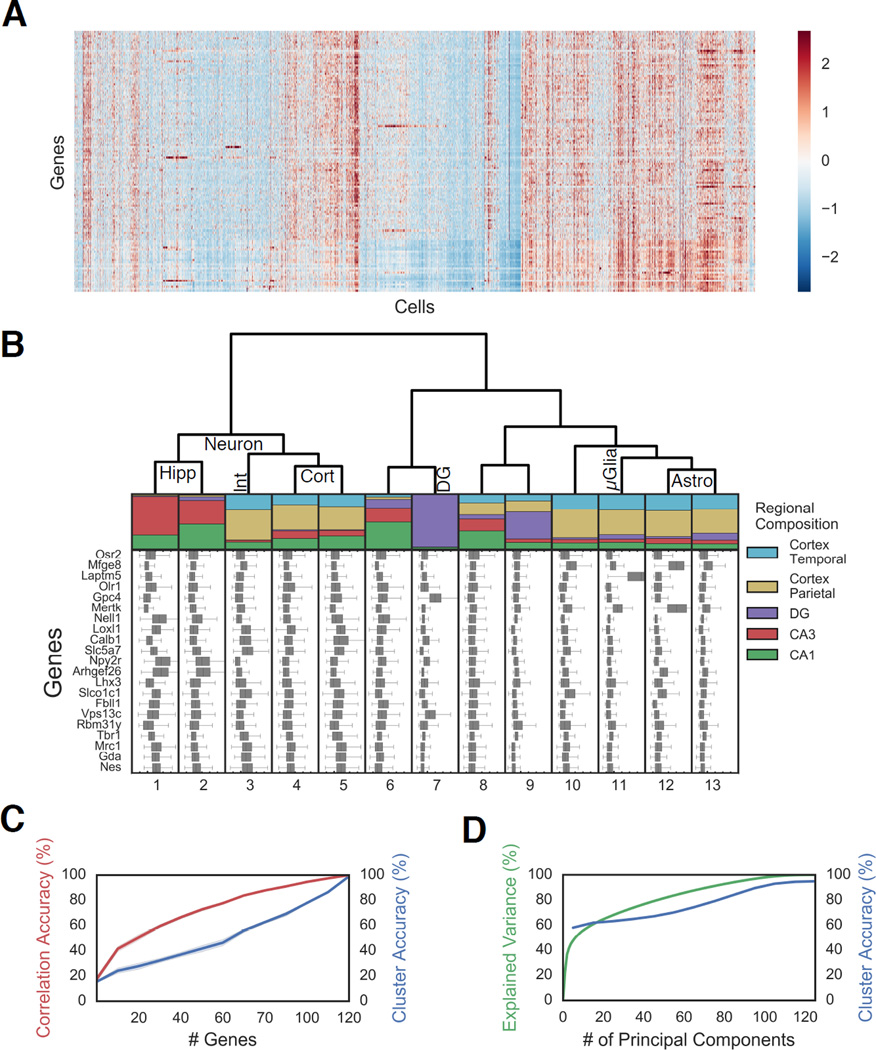
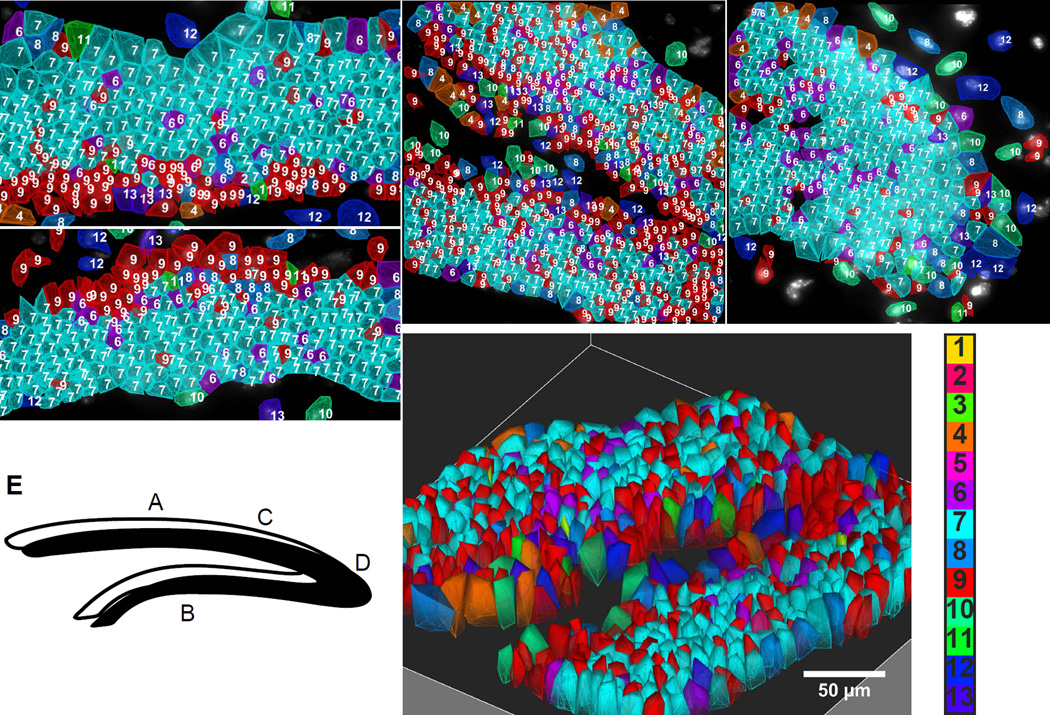
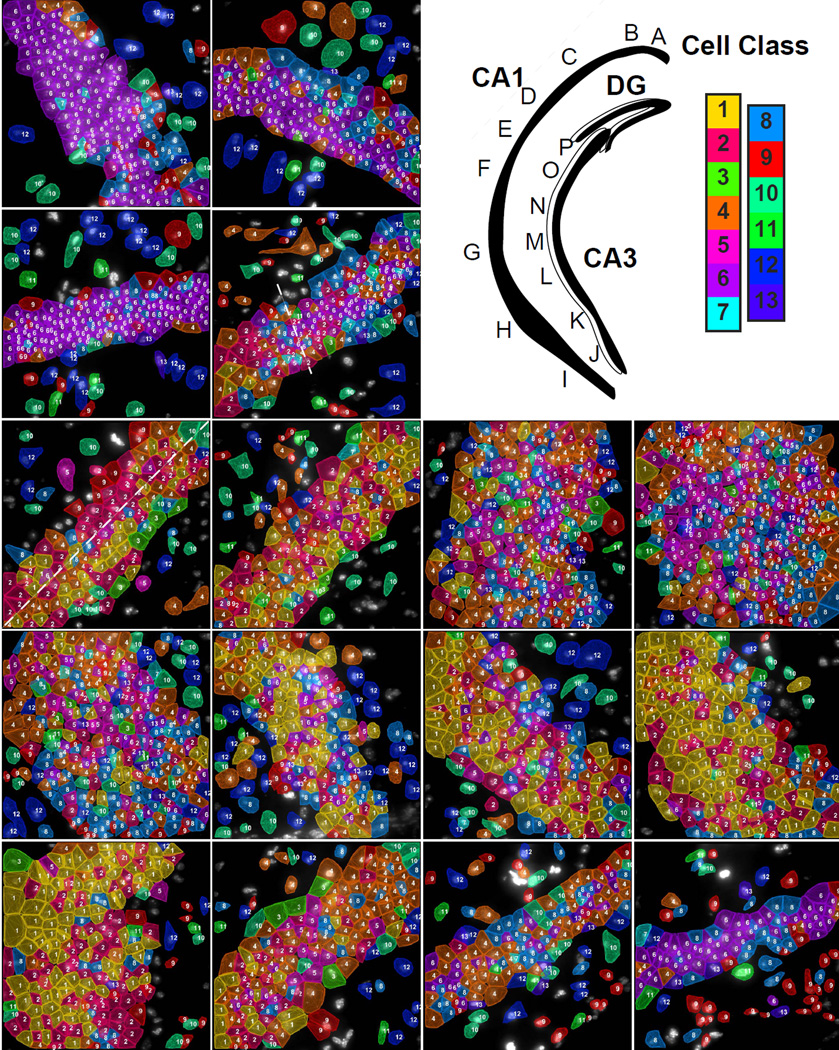
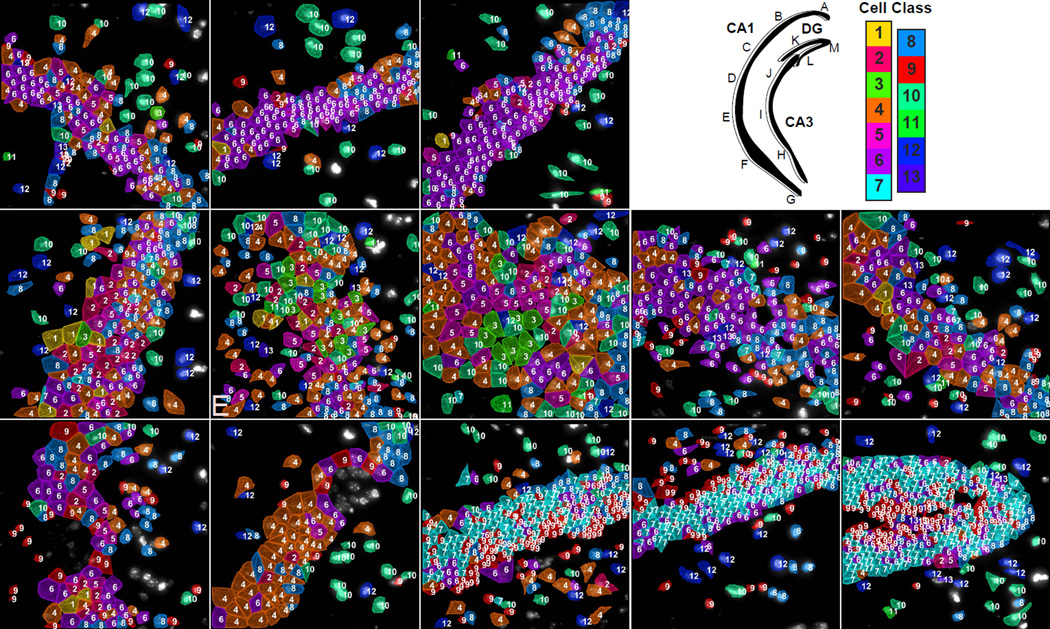
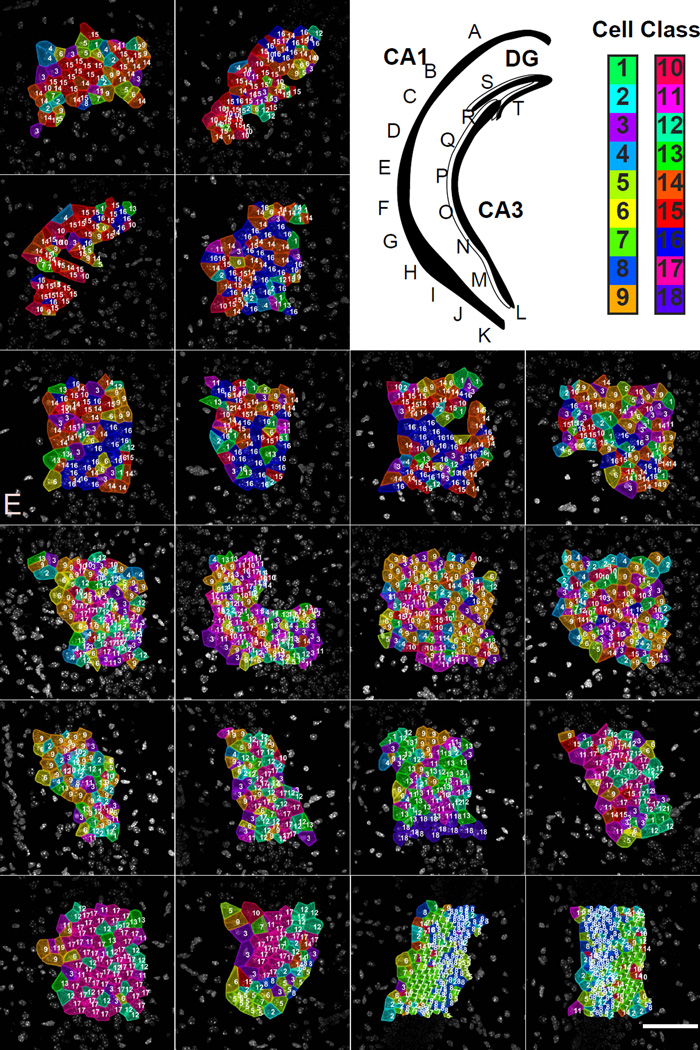
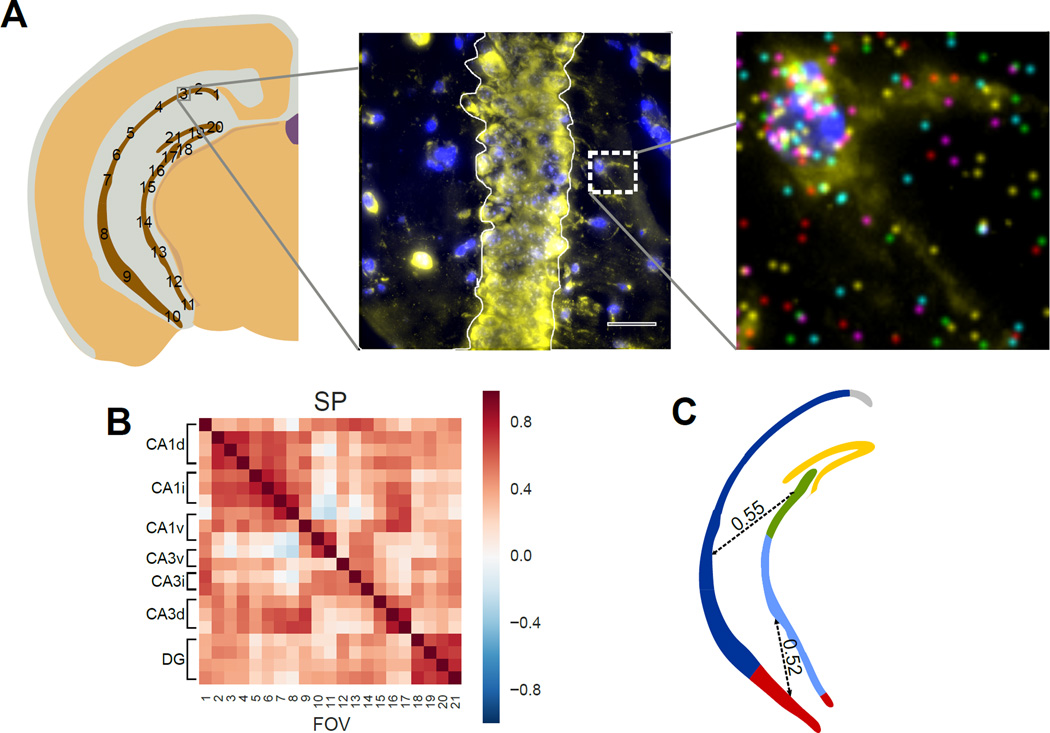
Identifying the spatial organization of tissues at cellular resolution from single-cell gene expression profiles is essential to understanding biological systems. Using an in situ 3D multiplexed imaging method, seqFISH, we identify unique transcriptional states by quantifying and clustering up to 249 genes in 16,958 cells to examine whether the hippocampus is organized into transcriptionally distinct subregions. We identified distinct layers in the dentate gyrus corresponding to the granule cell layer and the subgranular zone and, contrary to previous reports, discovered that distinct subregions within the CA1 and CA3 are composed of unique combinations of cells in different transcriptional states. In addition, we found that the dorsal CA1 is relatively homogeneous at the single cell level, while ventral CA1 is highly heterogeneous. These structures and patterns are observed using different mice and different sets of genes. Together, these results demonstrate the power of seqFISH in transcriptional profiling of complex tissues.


Figures

Fig. 1
Fig. 1. Overview of the Sequential barcode FISH (seqFISH) in brain slices
A. A coronal section from a mouse brain was mounted on a slide and imaged in all boxed areas. Each image was taken at 60x magnification. B. Example of barcoding hybridizations from one cell in field from A. The same points are re-probed through a sequence of 4 hybridizations (numbered). The sequence of colors at a given location provides a barcode readout for that mRNA (“barcode composite”). These barcodes are identified through referencing a lookup table abbreviated in D and quantified to obtain single cell expression. In principle, the maximum number of transcripts that can be identified with this approach scales to FN, where F is the number of fluorophores and N is the number of hybridizations. Error correction adds another round of hybridization. C. Serial smHCR is an alternative detection method where 5 genes are quantified in each hybridization and repeated N times. Serial hybridization scales as F*N. D. Schematic for multiplexing 125 genes in single cells. 100 genes are multiplexed in 4 hybridizations by seqFISH barcoding. This barcode scheme is tolerant to loss of any round of hybridization in the experiment. 25 genes are serially hybridized 5 genes at a time by 5 rounds of hybridization. Each number represents a color channel in single molecule HCR. As a control, 5 genes are measured both by double rounds of smHCR as well as barcoding in the same cell. E. SmHCR amplifies signal from individual mRNAs. After imaging, DNAse strips the smHCR probes from the mRNA, enabling rehybridization on the same mRNA (step a). The “color” of an mRNA can be modulated by hybridizing probes that trigger HCR polymers labeled with different dyes (step b). mRNA are amplified following hybridization by adding the complementary hairpin pair (step c). The DNAse smHCR cycle is repeated on the same mRNAs to construct a predefined barcode over time.
Fig. 2
Fig. 2. seqFISH generate accurate in situ quantification of mRNA levels
A. Image of seqFISH barcoding 100 genes in the outer layer of the mouse cortex. RNA dots in the image are z projected over 15µm. Individual mRNA points are shown across 4 hybridizations in the inset images. White squares correspond to identified barcodes, yellow squares correspond to missing transcripts in a particular hybridization, red squares correspond to spurious false positives and are not counted in any barcode measurements. Numbers in the squares correspond to barcode indices. B. seqFISH correlates with smHCR counts. After barcoding, 5 target mRNAs were measured twice by smHCR in the same cells, providing absolute counts of the transcripts. The two techniques correlate with an R=0.85 and a slope (m) of 0.84 (n=3851 measurements). The 2D histogram intensity shows the distribution of points around the regression line. A high density of points is seen along the regression line. The density falls off steeply around the regression line. C. Error correction results in a median gain of 373 (25%) counts per cell (n=3497). Red and blue curves correspond to the total barcode counts per cell before and after error correction. D. Dropped and off-target barcodes represent a small source of error in seqFISH. 100 on-target barcodes and 525 off-target barcodes are measured per cell. Dropped barcodes are due to at least two overlapping dots appearing within the same region. E. Off-target barcodes are rarely observed and contribute minimally to the expression profile in single cells. Each of the 100 on-target barcodes (blue) and 525 off-target barcodes (red) are quantified per cell. The mean is shown with shaded regions corresponding to 1 SD (N=41 imaged regions).
Fig. 3
Fig. 3. Distinct clusters of cells exhibit different regional localization in the brain
A. Gene expression of 14,908 cells presented as a Z-score normalized heatmap. B. Regional compositions of 13 cell clusters are visualized as stacked bar plots with the area corresponding the to number of cells in each region. Hippocampal regions are: CA3, CA1, Dentate Gyrus (DG). Cortical regions: parietal and temporal. Box plot of the Z scores of 21 representative genes are plotted for each cell class. The major tick marks correspond to Z score 0 while every minor tick is a z score interval of 1. Cell type assignments are shown on the dendrogram. Abbreviations: Hippocampus pyramidal (Hipp), cortex (Cort), Dentate Gyrus (DG), Interneurons (Int), Astrocyes(Astro), Microglia (µGlia). C. Any random subset of 25 genes can recapitulate approximately 50% of the information in the correlation amongst cells (red), but a larger number of genes are required to accurately assign cells to cluster using a random forest algorithm (blue) (n=10 bootstrap replicates; shading is 95% CI), indicating that fine structures in the data require quantitative measurements of combinatorial expression of many genes. D. Similar to C, while the first ten PCs explain the coarse structure, a larger number of principal components (PCs) are required to describe the full data. Expected variation (green) and accuracy in predicting cell identity using a random forest model (blue).
Fig. 4
Fig. 4. Spatial layering of cell classes in the Dentate Gyrus (DG)
A–B. Suprapyramidal and infrapyramidal blades of DG. Cells of the subgranular zone and granule cells are arranged in lamina layers in mirror symmetric patterns on the upper and lower blades. C. The SGZ stays on the inner layer of the DG fork. D. Cells are patterned in the crest. Numbered color key corresponds to cluster numbers in Fig 3b. E. Letters in the cartoon of DG correspond to images. F. 3D image of the fork region shown in C.
Fig. 5
Fig. 5. Subregions of the hippocampus are composed of distinct compositions of cell classes based on the first 125 gene experiment
Upper right panel. Cartoon of hippocampus with imaged regions labeled. Color key corresponds to the classes in Fig 3b. A–D. These images are regions from the CA1d. Astrocytes (Astro) are marked in image A and a microglia cell (µGlia) is marked in image B. Moving along the hippocampus from CA1 dorsal to ventral, cell classes transition from a homogenous dorsal population (C to D) to a mixed population in the CA1 intermediate (E–F) to regions of even larger cellular diversity in the CA1 ventral region (G–I). The dotted line in D marks the transition point of the CA1d to the CA1i. E shows two laterally segregated cell classes (marked by a dotted line) in the CA1i along with cholinergic interneurons (Int) on the interior surface of the CA1i. The ventral (J–K) and intermediate CA3 (L–M) have similar cell classes compositions to the CA1v and CA1i. The two last regions (O–P) of the dorsal CA3 shows distinct cell classes compositions that are relatively homogeneous within a field but are different than other fields of CA3. The cell class composition of field P is similar to that of the CA1d, but these cluster 6 cells are grouped into a distinct subcluster.
Fig. 6
Fig. 6. Mapping of cell types to a second brain slice with 125 genes
Upper right panel. Cartoon of hippocampus with imaged regions labeled. Color key corresponds to the classes in Fig 3b. A–D. Similar to the cell class compositions shown for the hippocampus in Fig 5, CA1d in this second coronal section from a second mouse is composed of mostly cluster 6 cells. (E) CA1i region and (F–G) the CA1 ventral regions are again composed of similar cell classes to that shown in figure 5 with increasing diversity of cell class compositions from the CA1d to the CA1i to finally the CA1v. (H–J) CA3 regions. (K–M) DG regions showing the same cell classes and layer pattern of the GCL and SGZ shown in Figure 4.
Fig. 7
Fig. 7. Mapping of cell types to a third brain slice with 249 genes
Upper right panel. Cartoon of hippocampus with imaged regions labeled. Color key corresponds to the classes in Fig S6C. A–C. Similar to the slice shown in Fig 5 and 6, CA1d is relatively homogenous in cell cluster composition. D–G. Images from the CA1i region show that the cell class composition is different from that of the CA1d. H–K. Again, similar to Fig 5 and 6, images from the CA1 ventral regions shows a much more complicated cellular composition and a high degree of cellular heterogeneity. L–R. Images from the CA3 region show that the cellular compositions also creates 3–4 subregions within the CA3. The cellular heterogeneity of the CA3 subregions mirrors that of the CA1, where the ventral region of the CA3 is very heterogenous while the dorsal region of the CA3 is relatively homogenous. S–T. The DG regions show the distinct SGZ versus GCL layering pattern seen in the previous two brains.
Fig 8
Fig 8. Correlations of the transcription profile across the pyramidal layer
A. mRNA counts in the cell bodies in the Stratum Pyramidale (SP) are grouped within each field of view. A single cell in the Stratum Radiatum (SR) is shown to illustrate individual mRNA localization. Stratum Oriens (SO) is labeled for orientation. B. mRNAs in different subregions of pyramidal layer show both long-distance spatial correlations as well as local correlations between neighboring fields. Both CA1 and Dentate Gyrus (DG) show high regional correlations. Correlation is calculated based on the 125 gene experiment. C. Illustration of regional and long distance correlation patterns observed in B. Correlated regions are colored and long distance correlations are shown as dotted lines with their median correlation coefficient written over the dotted line.

Comment in

References

    1. Beliveau BJ, Joyce EF, Apostolopoulos N, Yilmaz F, Fonseka CY, McCole RB, Chang Y, Li JB, Senaratne TN, Williams BR, et al. Versatile design and synthesis platform for visualizing genomes with Oligopaint FISH probes. Proc. Natl. Acad. Sci. U.S.A. 2012;109:21301–21306. - PMC - PubMed
    1. Betzig E, Patterson GH, Sougrat R, Lindwasser OW, Olenych S, Bonifacino JS, Davidson MW, Lippincott-Schwartz J, Hess HF. Imaging Intracellular Fluorescent Proteins at Nanometer Resolution. Science. 2006;313:1642–1645. - PubMed
    1. Breiman L. Random Forests. Mach. Learn. 2001;45:5–32.
    1. Cajigas IJ, Tushev G, Will TJ, Dieck S. tom, Fuerst N, Schuman EM. The Local Transcriptome in the Synaptic Neuropil Revealed by Deep Sequencing and High-Resolution Imaging. Neuron. 2012;74:453–466. - PMC - PubMed
    1. Cembrowski MS, Bachman JL, Wang L, Sugino K, Shields BC, Spruston N. Spatial Gene-Expression Gradients Underlie Prominent Heterogeneity of CA1 Pyramidal Neurons. Neuron. 2016;89:351–368. - PubMed