. 2016 Nov 22;7(47):77257-77275.
doi: 10.18632/oncotarget.12629.

PDGFR-alpha inhibits melanoma growth via CXCL10/IP-10: a multi-omics approach

Affiliations

PDGFR-alpha inhibits melanoma growth via CXCL10/IP-10: a multi-omics approach

Daniela D'Arcangelo et al. Oncotarget. .

Abstract

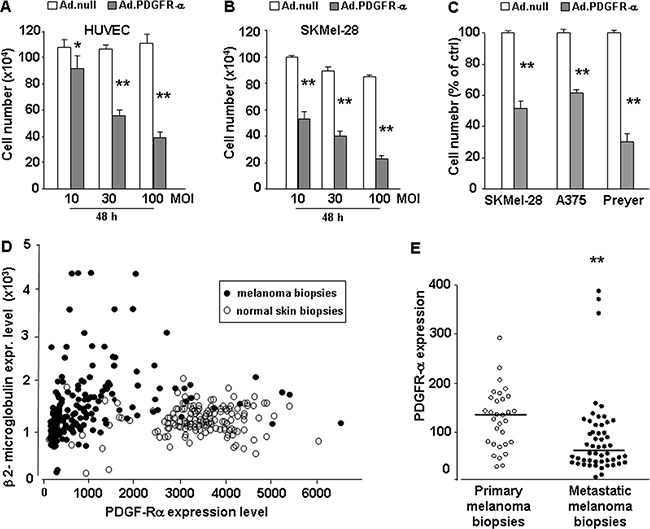
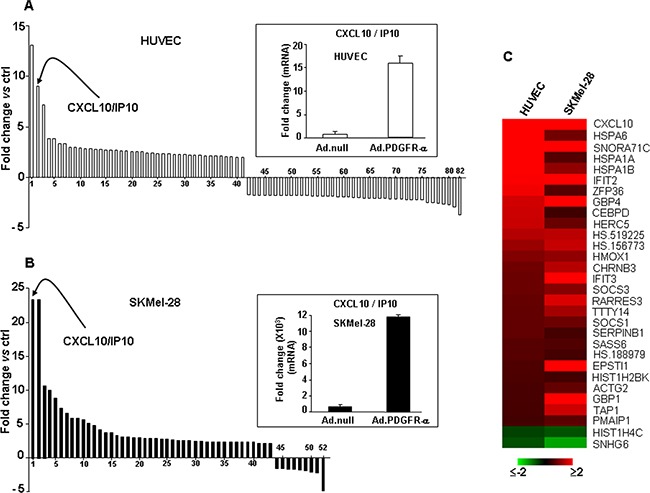
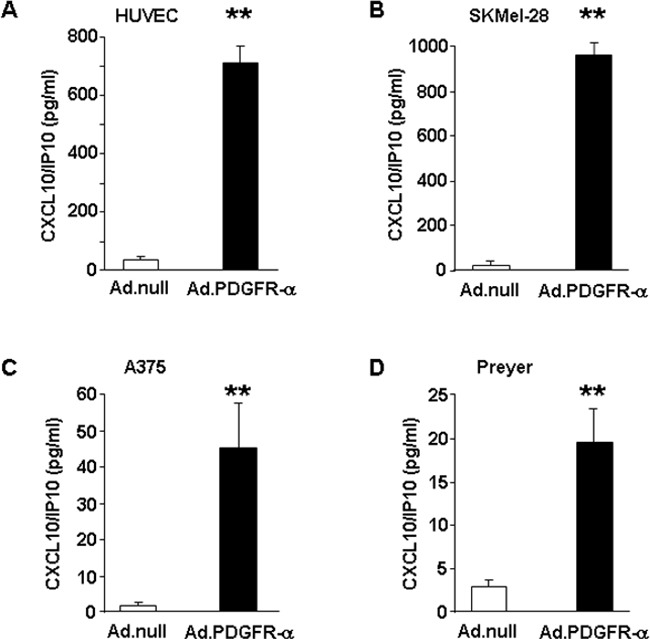
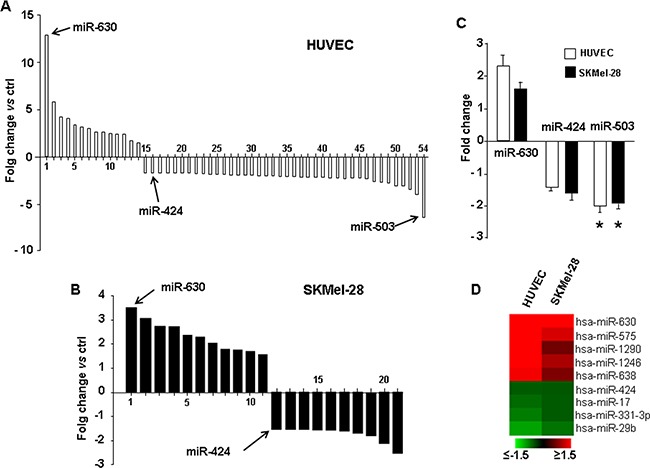
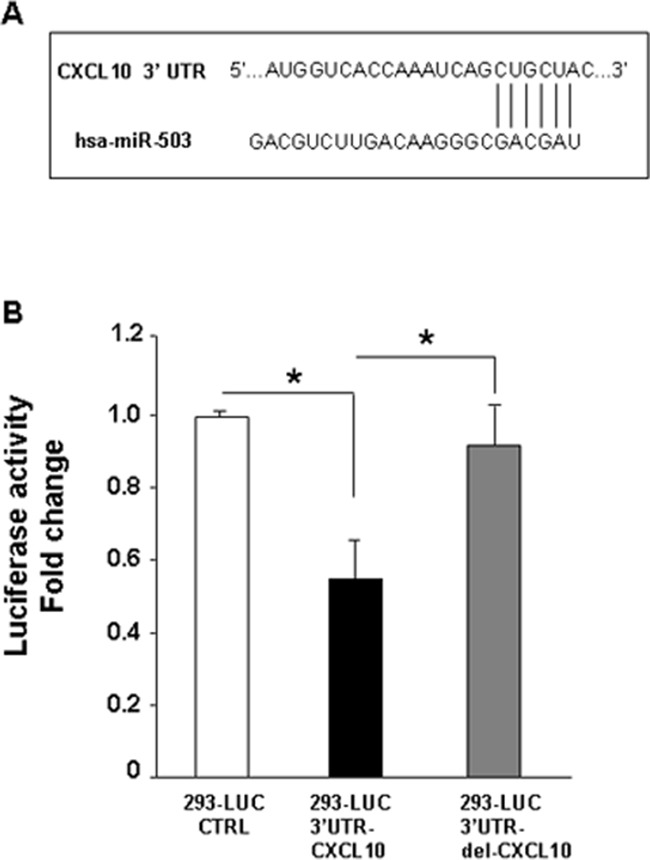
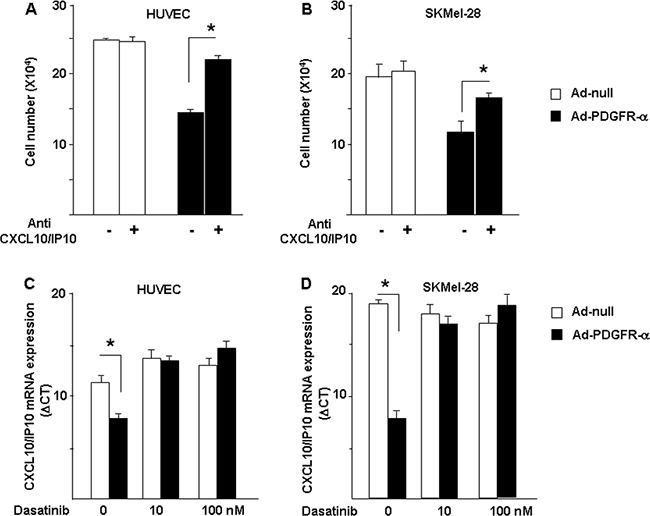
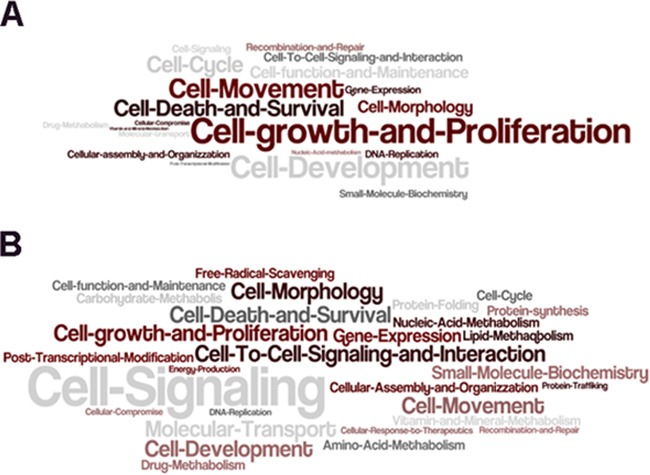
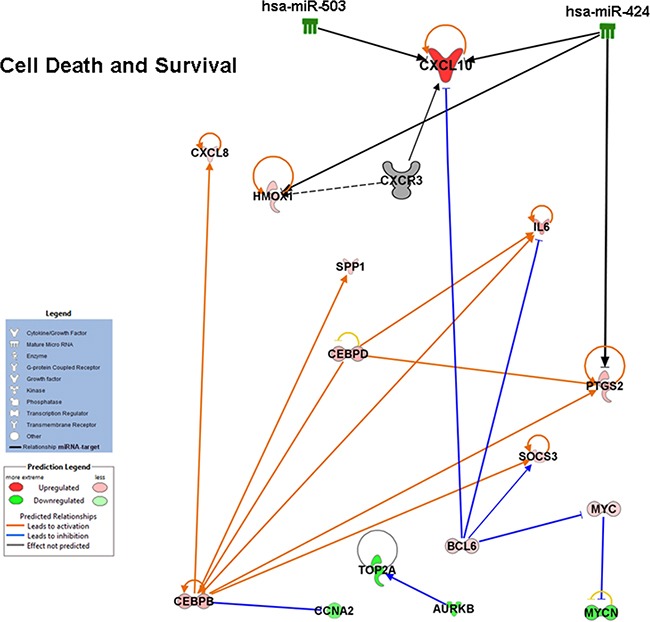
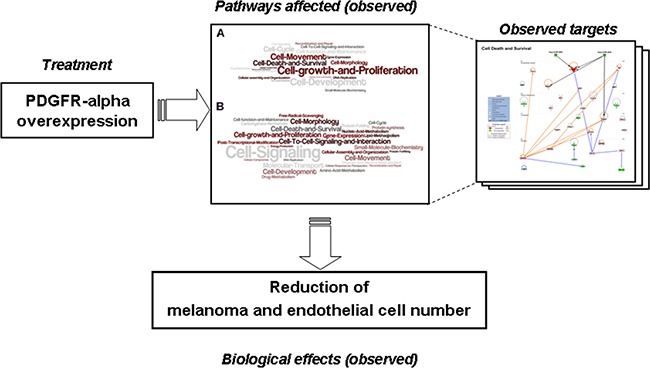
Melanoma is the most aggressive skin-cancer, showing high mortality at advanced stages. Platelet Derived Growth Factor Receptor-alpha (PDGFR-alpha) potently inhibits melanoma- and endothelium-proliferation and its expression is significantly reduced in melanoma-biopsies, suggesting that melanoma progression eliminates cells expressing PDGFR-alpha. In the present study transient overexpression of PDGFR-alpha in endothelial (HUVEC) and melanoma (SKMel-28, A375, Preyer) human-cells shows strong anti-proliferative effects, with profound transcriptome and miRNome deregulation. PDGFR-alpha overexpression strongly affects expression of 82 genes in HUVEC (41 up-, 41 down-regulated), and 52 genes in SKMel-28 (43 up-, 9 down-regulated). CXCL10/IP-10 transcript showed up to 20 fold-increase, with similar changes detectable at the protein level. miRNA expression profiling in cells overexpressing PDGFR-alpha identified 14 miRNAs up- and 40 down-regulated, with miR-503 being the most down-regulated (6.4 fold-reduction). miR-503, miR-630 and miR-424 deregulation was confirmed by qRT-PCR. Interestingly, the most upregulated transcript (i.e., CXCL10/IP-10) was a validated miR-503 target and CXCL10/IP-10 neutralization significantly reverted the anti-proliferative action of PDGFR-alpha, and PDGFR-alpha inhibition by Dasatinb totally reverted the CXCL10/IP10 induction, further supporting a functional interplay of these factors. Finally, integration of transcriptomics and miRNomics data highlighted several pathways affected by PDGFR-alpha.This study demonstrates for the first time that PDGFR-alpha strongly inhibits endothelial and melanoma cells proliferation in a CXCL10/IP-10 dependent way, via miR-503 down-regulation.

Keywords: angiogenesis; cancer; melanoma; miRNA; omics.


Conflict of interest statement

CONFLICTS OF INTEREST

No potential conflicts of interest were disclosed.

Figures

Figure 1
Figure 1. Effect of PDGFR-alpha overexpression on endothelial (HUVEC) and melanoma (SKMel-28) cells proliferation
Proliferation of HUVEC and SKMel-28 infected with Ad-vector codingfor PDGFR-alpha. A, B.: Dose-dependent effects of 10, 30, and 100 MOI AdCMV.PDGFR-alpha infection; 10% FCS–induced proliferation at 48 hours. *p value < 0.05 and **p value <0.01 versus AdCMV.null (cell number at T = 0 corresponds to 7.5 ×10⁵). Data are reported as mean ± SD of 3 independent experiments. C. Effects of AdCMV.PDGFR-alpha infection in SKMel-28, A375 and Preyer cell lines. Data are reported as % of control D. Expression of PDGFR-alpha (X axis) vs expression of the housekeeping gene beta 2-microglobulin (Y axis) in 208 melanoma biopsies (black spots) and 147 normal skin biopsies. Expression data were derived from ist.medisapiens.com site. Supplementary Figure 2SA-2SB reports correlation plots of PDGFR-alpha with other housekeeping genes, namely Tubulin Beta 1 gene (Supplementary Figure 2SA) and Actin beta gene (Figure 2SB). In all cases PDGFR-alpha is strongly reduced in melanoma samples vs normal skin samples. E. Mean PDGFR-alpha expression in 31 primary human melanoma biopsies and in 52 metastatic human melanoma biopsies is significantly reduced (p = 0.0002). Analysis carried onto GEO database, GDS3966 dataset (Xu 2008) (http://www.ncbi.nlm.nih.gov/pubmed). Expression values are reported. Graphing the “ranks values” of PDGFR-alpha (instead of the “uncorrected values”) does not modify the significant reduction in metastatic vs primary samples (0.58 vs 0.73, p = 0.0004). Beta 2-microglobulin, beta actin or tubulin beta1 ranks are very stable, invariantly 99 or 100 in all melanoma samples, independently from the “primary” or “metastatic” diagnosis.
Figure 2
Figure 2. Gene expression profiling and validation in endothelial cells and melanoma overexperessing PDGFR-alpha
A. Bar graph depicts the top 41 transcripts up-regulated and top 41 down-regulated in HUVEC. Inset reports the corresponding validation by qRT-PCR. Data are reported as mean ± SD of 3 independent experiments. The complete list of 216 differentially modulated transcripts is reported in Supplementary Table S1. B. Bar graph depicts the top 43 transcripts up-regulated and top 9 down-regulated in SKMel-28. CXCL10/IP-10 transcript was found strongly up-regulated both in HUVEC and SKMel-28. Inset reports the corresponding validation by qRT-PCR, carried out as 3 independent experiments. Data are reported as mean ± SD. The complete list of 107 differentially modulated transcripts is reported in Supplementary Table S2). C. Heatmap depicting all common differentially regulated transcripts in HUVEC and SKMel-28 over-expressing PDGFR-alpha as compared to Ad.null infected cells.
Figure 3
Figure 3. CXCL10/IP10 protein expression
CXCL10/IP-10 expression level measured in cell lysates obtained from endothelial (HUVEC) and melanoma (SKMel-28, A375, Preyer) cells over-expressing PDGFR-alpha, as compared to Ad.null-infected cells. Data are reported as mean ± SD of 3 independent experiments and normalized by total protein content.
Figure 4
Figure 4. miRNA profiling and qRT-PCR validation
miRNome profiling in HUVEC A. and SKMel-28 cells B. overexpressin PDGFR-alpha vs Ad.null control cells. The complete list of all differentially expressed miRNAs is reported in Supplementary Table S3 and Supplementary Table S4, along with the exact fold changes and computed p values. C. qRT-PCR validation, in HUVEC and SKMel-28 cells overexpressing PDGFR-alpha. Data are reported as mean ± SD of 3 independent experiments. D. Heatmap depicting all common differentially regulated miRNAs in HUVEC and SKMel-28 over-expressing PDGFR-alpha as compared to Ad.null infected cells.
Figure 5
Figure 5. Target prediction of miR-503 and validation
A. CXCL10/IP-10 was predicted to be one of the miR-503 targets according to TargetScan software, given the complementarity of CXCL10/IP-10 3′UTR and miR-503 seed sequence. B. 3′-UTR-Luc assay shows a significant decrease (about 50%, p value < 0.0001) in Luciferase reporter expression in transiently transfected 3′-UTR CXCL10/IP10 Luciferase stable 293 cell line with miR-503, as compared to the control vector, and a significant reversion is observed when a deleted form of the 3′-UTR CXCL10/IP-10 was used as specificity control. Data are reported as mean ± SD of 3 independent experiments.
Figure 6
Figure 6. Mechanisms characterization
Neutralization of CXCL10/IP10 reverts PDGFR-alpha-dependent growth inhibition. The key role of CXCL10/IP-10 to mediate the anti-proliferation effect of PDGFR-alpha was confirmed by the use of the neutralizing antibody anti-CXCL10/IP-10, which partially but significantly reverts the inhibitory effect of PDGR-alpha overexpression, in both HUVEC A. and SKMel-28 B. cells. The anti-tumor drug Dasatinb, known inhibitor of PDGFR-alpha and other tyrosine-kinases, completely restores CXCL10/IP10 expression (expressed as ΔCT). Data are reported as mean ± SD of 3 independent experiments.
Figure 7
Figure 7. IPA Functional Analysis
Word Cloud analysis of significantly enriched molecular functions identified by IPA functional analysis considering differentially expressed transcripts in HUVEC A. and SKMel-28 cell B. over-expressing PDGFR-alpha. The text size is inversely proportional to the log p value ≤ 0.05 (Fisher's exact test).
Figure 8
Figure 8. Integration of miRNA and transcriptome changes occurring in HUVEC cells
Functional network obtained by IPA analysis highlighting inverse relationships between miRNA and transcripts expression induced by PDGR-alpha overexpression. Gene expression- and miRNA- microarray data were integrated.
Figure 9
Figure 9. Cartoon summarizing the intervention and the cellular reactions observed in the current study
Over-expressing PDGFR-alpha induces reduction of melanoma and endothelial cell number affecting several molecular functions via up- and down- regulation of several interconnected molecules.

References

    1. Palmieri G, Capone M, Ascierto ML, Gentilcore G, Stroncek DF, Casula M, Sini MC, Palla M, Mozzillo N, Ascierto PA. Main roads to melanoma. J Transl Med. 2009;7:86. - PMC - PubMed
    1. Bränström R, Chang Y-M, Kasparian N, Affleck P, Tibben A, Aspinwall LG, Azizi E, Baron-Epel O, Battistuzzi L, Bruno W, Chan M, Cuellar F, et al. Melanoma risk factors, perceived threat and intentional tanning: an international online survey. Eur J Cancer Prev. 2010;19:216–26. - PMC - PubMed
    1. Burkhart CG, Burkhart CN. Melanoma risk factors include insecticides and occupational exposures. Int J Dermatol. 2009;48:210. - PubMed
    1. Postow MA, Harding J, Wolchok JD. Targeting immune checkpoints: releasing the restraints on anti-tumor immunity for patients with melanoma. Cancer J. 2013;18:153–9. - PMC - PubMed
    1. Funt SA, Page DB, Wolchok JD, Postow MA. CTLA-4 antibodies: new directions, new combinations. Oncology (Williston Park) 2014;28(Suppl 3):6–14. - PubMed

MeSH terms

LinkOut - more resources