. 2016 Oct 20;10(1):96.
doi: 10.1186/s12918-016-0341-9.

Attractor landscape analysis of colorectal tumorigenesis and its reversion

Affiliations

Attractor landscape analysis of colorectal tumorigenesis and its reversion

Sung-Hwan Cho et al. BMC Syst Biol. .

Abstract

Background: Colorectal cancer arises from the accumulation of genetic mutations that induce dysfunction of intracellular signaling. However, the underlying mechanism of colorectal tumorigenesis driven by genetic mutations remains yet to be elucidated.

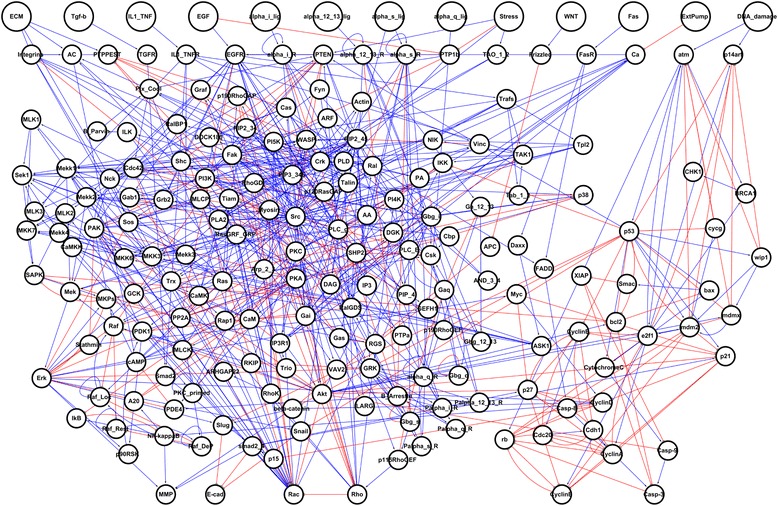
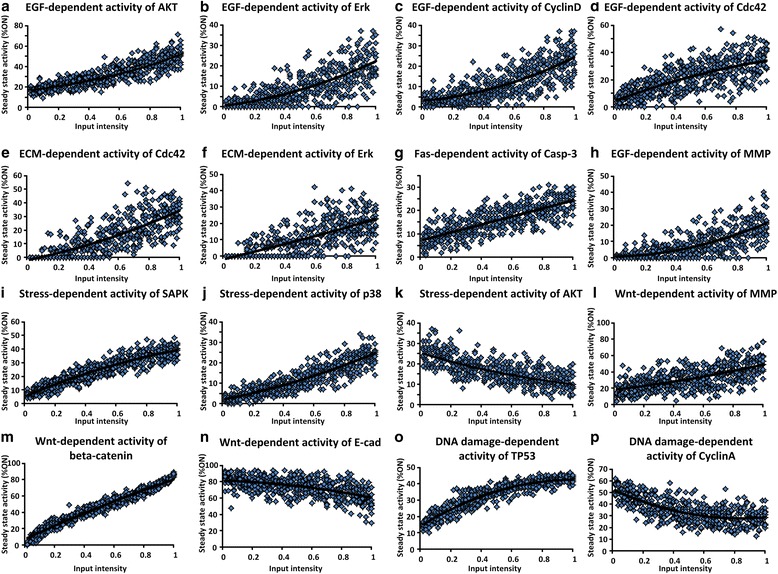
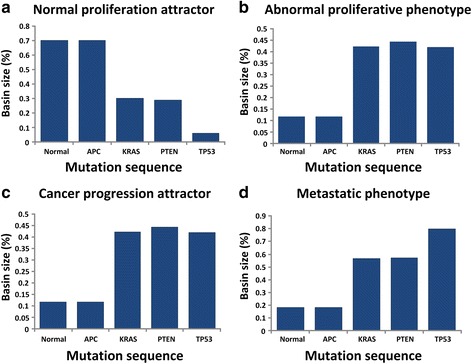
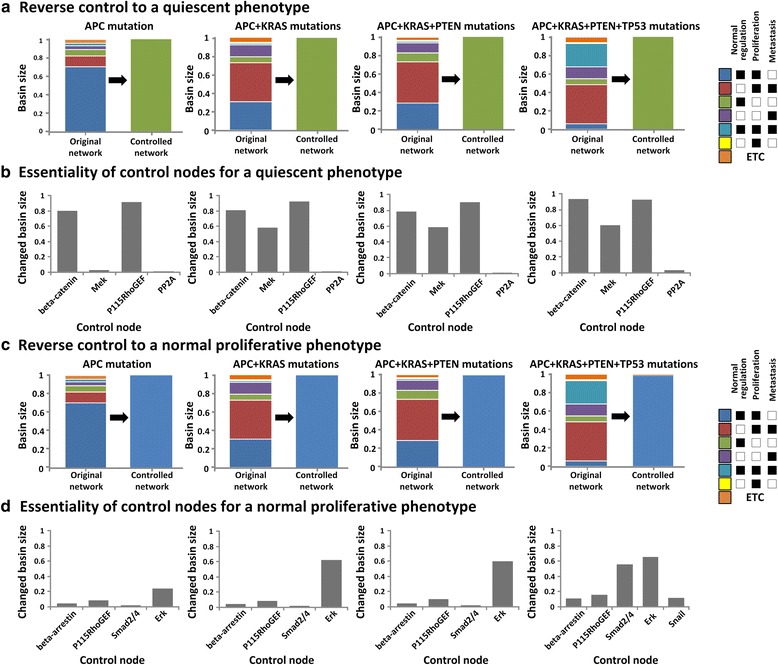
Results: To investigate colorectal tumorigenesis at a system-level, we have reconstructed a large-scale Boolean network model of the human signaling network by integrating previous experimental results on canonical signaling pathways related to proliferation, metastasis, and apoptosis. Throughout an extensive simulation analysis of the attractor landscape of the signaling network model, we found that the attractor landscape changes its shape by expanding the basin of attractors for abnormal proliferation and metastasis along with the accumulation of driver mutations. A further hypothetical study shows that restoration of a normal phenotype might be possible by reversely controlling the attractor landscape. Interestingly, the targets of approved anti-cancer drugs were highly enriched in the identified molecular targets for the reverse control.

Conclusions: Our results show that the dynamical analysis of a signaling network based on attractor landscape is useful in acquiring a system-level understanding of tumorigenesis and developing a new therapeutic strategy.

Keywords: Attractor landscape analysis; Cancer reversion; Colorectal tumorigenesis; Human signaling network; Reverse control; Systems biology.


Figures

Fig. 1
Fig. 1
The human signaling network. The large-scale human signaling network consists of 197 nodes and 688 links; blue color, pointed arrows mean positive regulation links and red color, blunted arrows mean inhibitory regulation links. Among 197 nodes, there are 13 external-input nodes (see Additional file 1). The input nodes are represented by large circles
Fig. 2
Fig. 2
Qualitative input–output relationships in the Boolean model of human signaling network. a Positive relationship between EGF and AKT activation [62]. b Positive relationship between EGF and ERK activation [63]. c Positive relationship between EGF and CyclinD activation [34]. d Positive relationship between EGF and Cdc42 activation [64]. e Positive relationship between ECM and Cdc42 activation [65]. f Positive relationship between ECM and ERK activation [66]. g Positive relationship between Fas and Casp-3 activation [67]. h Activation of MMP by EGF [68]. i-j Stress-induced activation of SAPK and p38 [63, 69]. k Stress-induced inhibition of AKT [70]. l-m Wnt-induced activation of MMP and beta-catenin [71]. n Negative relationship between Wnt and E-cadherin [71]. o Positive relationship between DNA damage and TP53 activation [72]. p Negative relationship between DNA damage and CyclinA activation [73]. Note that the dose–response curves shown here are intended to demonstrate how the human signaling network model qualitatively reproduces the known input–output relationships over a wide range of inputs
Fig. 3
Fig. 3
The change of attractor basin along with the sequential accumulation of driver mutations during colorectal tumorigenesis. a The basin size of a normal proliferation attractor. The basin size of a normal proliferation attractor was decreased by KRAS and TP53 mutations. b The basin size of an abnormal proliferative phenotype attractor. The basin size of an abnormal proliferative phenotype attractor was significantly increased by KRAS mutation. c The basin size of a cancer progression attractor. The basin size of a cancer progression attractor was increased by KRAS mutation. d The basin size of a metastatic phenotype attractor. The basin size of a metastatic phenotype attractor shows an increasing tendency by sequential accumulation of driver mutations. In particular, the mutations of KRAS and TP53 dramatically increased the size of a metastatic phenotype attractor
Fig. 4
Fig. 4
Distribution of the basin size for the phenotype attractors in the attractor landscape before and after performing reverse control and the essentiality of control nodes for each accumulation stage of driver mutations. a and c The results of reverse control for transforming the cellular state to a quiescent or normal proliferative phenotype. a Reverse control to a quiescent phenotype (green color). c Reverse control to a normal proliferative phenotype (blue color). We should reshape the attractor landscape at each accumulation stage of driver mutations to make all initial states of attractor landscape converge to the attractor of a quiescent or a normal proliferative phenotype by regulating the activity of control nodes. In the right panel, colored boxes represent the classified attractors that indicate different cellular phenotypes. More details about the attractor classification are described in the main text. b and d Essentiality of control nodes identified in the reverse control. b Essentiality of control nodes for a quiescent phenotype. d Essentiality of control nodes for a normal proliferative phenotype. The essentiality indicates the capability of each control node to change the original attractor landscape into the desired one
Fig. 5
Fig. 5
The enrichment of approved drug-targets in the identified control nodes and the random nodes of the human signaling network. a The enrichment of approved drug-targets in the control nodes for a quiescent phenotype and the random nodes. b The enrichment of approved drug-targets in the control nodes for a normal proliferative phenotype and the random nodes. Control nodes are listed in Table 1

References

    1. Kolch W, Halasz M, Granovskaya M, Kholodenko BN. The dynamic control of signal transduction networks in cancer cells. Nat Rev Cancer. 2015;15(9):515–527. doi: 10.1038/nrc3983. - DOI - PubMed
    1. Guney E, Menche J, Vidal M, Barabasi AL. Network-based in silico drug efficacy screening. Nat Commun. 2016;7:10331. doi: 10.1038/ncomms10331. - DOI - PMC - PubMed
    1. Hanahan D, Weinberg RA. The hallmarks of cancer. Cell. 2000;100(1):57–70. doi: 10.1016/S0092-8674(00)81683-9. - DOI - PubMed
    1. Cui Q, Ma Y, Jaramillo M, Bari H, Awan A, Yang S, Zhang S, Liu L, Lu M, O’Connor-McCourt M, et al. A map of human cancer signaling. Mol Syst Biol. 2007;3:152. doi: 10.1038/msb4100200. - DOI - PMC - PubMed
    1. Armaghany T, Wilson JD, Chu Q, Mills G. Genetic alterations in colorectal cancer. Gastrointest Cancer Res. 2012;5(1):19–27. - PMC - PubMed

Publication types

MeSH terms