

Evaluating Google, Twitter, and Wikipedia as Tools for Influenza Surveillance Using Bayesian Change Point Analysis: A Comparative Analysis
- PMID: 27765731
- PMCID: PMC5095368
- DOI: 10.2196/publichealth.5901
Evaluating Google, Twitter, and Wikipedia as Tools for Influenza Surveillance Using Bayesian Change Point Analysis: A Comparative Analysis
Abstract
Background: Traditional influenza surveillance relies on influenza-like illness (ILI) syndrome that is reported by health care providers. It primarily captures individuals who seek medical care and misses those who do not. Recently, Web-based data sources have been studied for application to public health surveillance, as there is a growing number of people who search, post, and tweet about their illnesses before seeking medical care. Existing research has shown some promise of using data from Google, Twitter, and Wikipedia to complement traditional surveillance for ILI. However, past studies have evaluated these Web-based sources individually or dually without comparing all 3 of them, and it would be beneficial to know which of the Web-based sources performs best in order to be considered to complement traditional methods.
Objective: The objective of this study is to comparatively analyze Google, Twitter, and Wikipedia by examining which best corresponds with Centers for Disease Control and Prevention (CDC) ILI data. It was hypothesized that Wikipedia will best correspond with CDC ILI data as previous research found it to be least influenced by high media coverage in comparison with Google and Twitter.
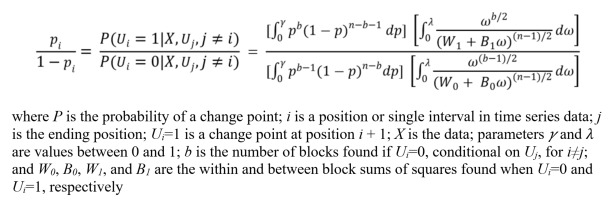
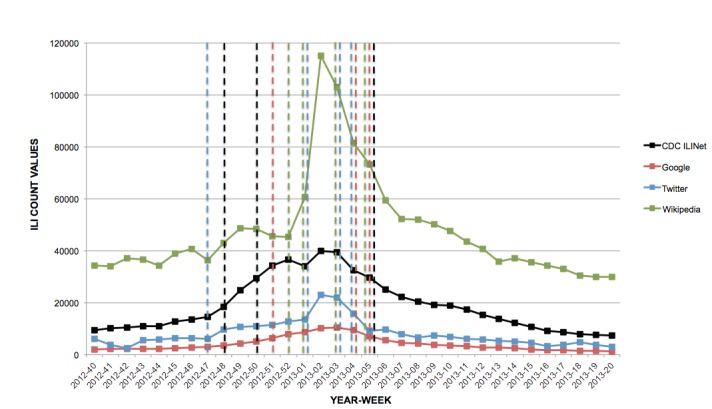
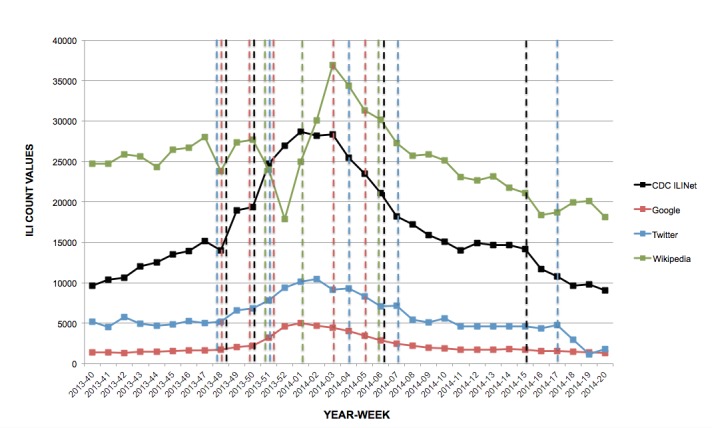
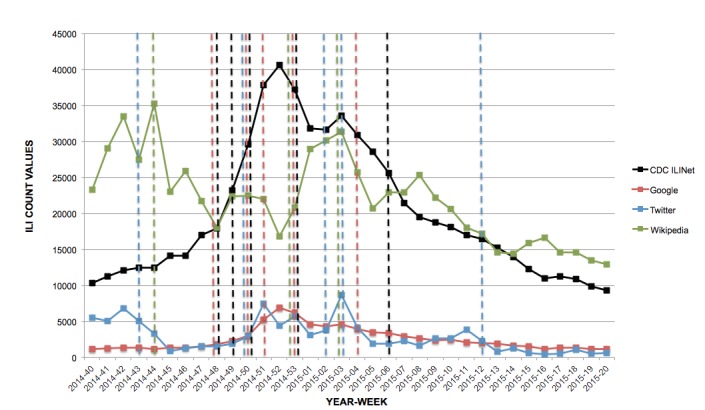
Methods: Publicly available, deidentified data were collected from the CDC, Google Flu Trends, HealthTweets, and Wikipedia for the 2012-2015 influenza seasons. Bayesian change point analysis was used to detect seasonal changes, or change points, in each of the data sources. Change points in Google, Twitter, and Wikipedia that occurred during the exact week, 1 preceding week, or 1 week after the CDC's change points were compared with the CDC data as the gold standard. All analyses were conducted using the R package "bcp" version 4.0.0 in RStudio version 0.99.484 (RStudio Inc). In addition, sensitivity and positive predictive values (PPV) were calculated for Google, Twitter, and Wikipedia.
Results: During the 2012-2015 influenza seasons, a high sensitivity of 92% was found for Google, whereas the PPV for Google was 85%. A low sensitivity of 50% was calculated for Twitter; a low PPV of 43% was found for Twitter also. Wikipedia had the lowest sensitivity of 33% and lowest PPV of 40%.
Conclusions: Of the 3 Web-based sources, Google had the best combination of sensitivity and PPV in detecting Bayesian change points in influenza-related data streams. Findings demonstrated that change points in Google, Twitter, and Wikipedia data occasionally aligned well with change points captured in CDC ILI data, yet these sources did not detect all changes in CDC data and should be further studied and developed.
Keywords: Bayes theorem; Internet; influenza, human; public health surveillance; social media.
Conflict of interest statement
Conflicts of Interest: None declared.
Figures
References
-
- Centers for Disease Control and Prevention Estimates of deaths associated with seasonal influenza --- United States, 1976-2007. MMWR Morb Mortal Wkly Rep. 2010;59(33):1057–1062. - PubMed
-
- Centers for Disease Control and Prevention. 2015. [2016-03-26]. Overview of influenza surveillance in the United States http://www.cdc.gov/flu/weekly/overview.htm .
-
- Buehler JW, Hopkins RS, Overhage JM, Sosin DM, Tong V. Framework for evaluating public health surveillance systems for early detection of outbreaks: recommendations from the CDC Working Group. MMWR Recomm Rep. 2004 May 7;53(RR-5):1–11. http://www.cdc.gov/mmwr/preview/mmwrhtml/rr5305a1.htm rr5305a1 - PubMed
LinkOut - more resources
Full Text Sources
Other Literature Sources
Miscellaneous
