

Influence of menopause status and age on integrated central and peripheral hemodynamic responses to subsystolic cuffing during submaximal exercise
- PMID: 27765745
- PMCID: PMC5206348
- DOI: 10.1152/ajpheart.00310.2016
Influence of menopause status and age on integrated central and peripheral hemodynamic responses to subsystolic cuffing during submaximal exercise
Abstract
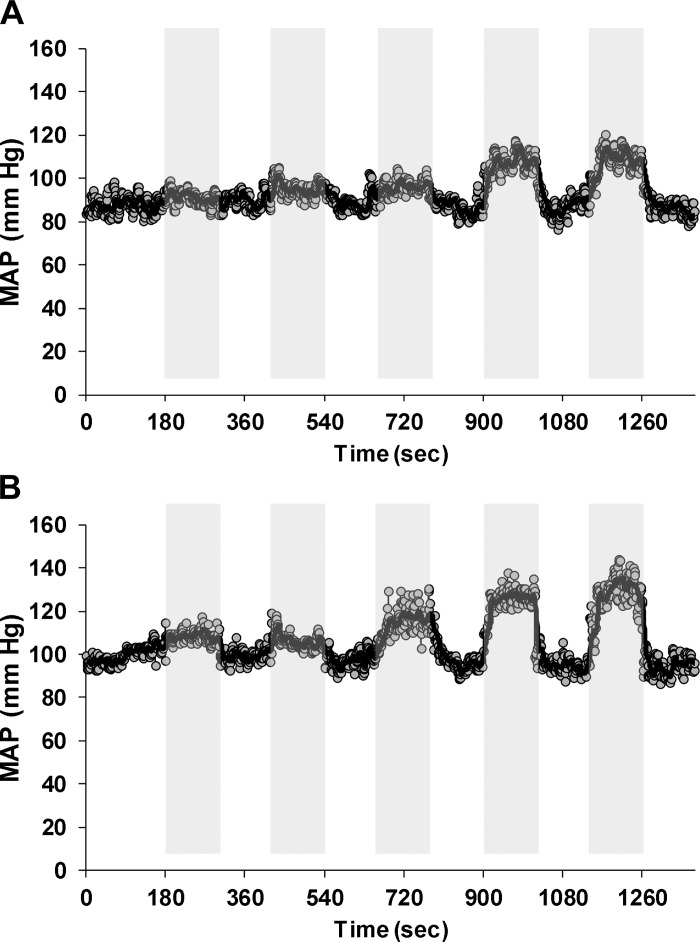
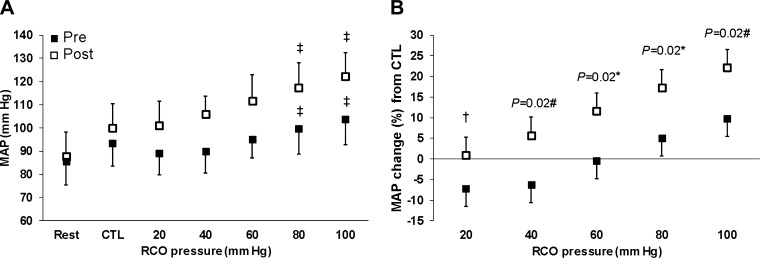
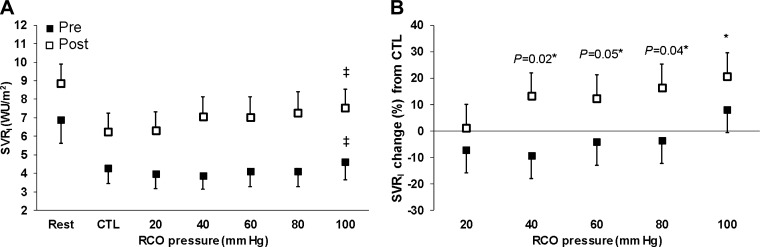
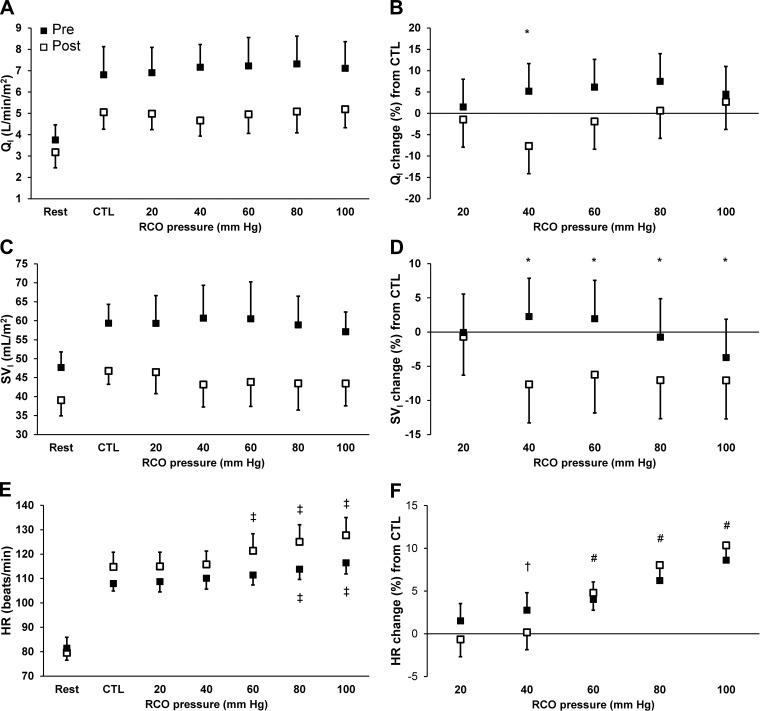
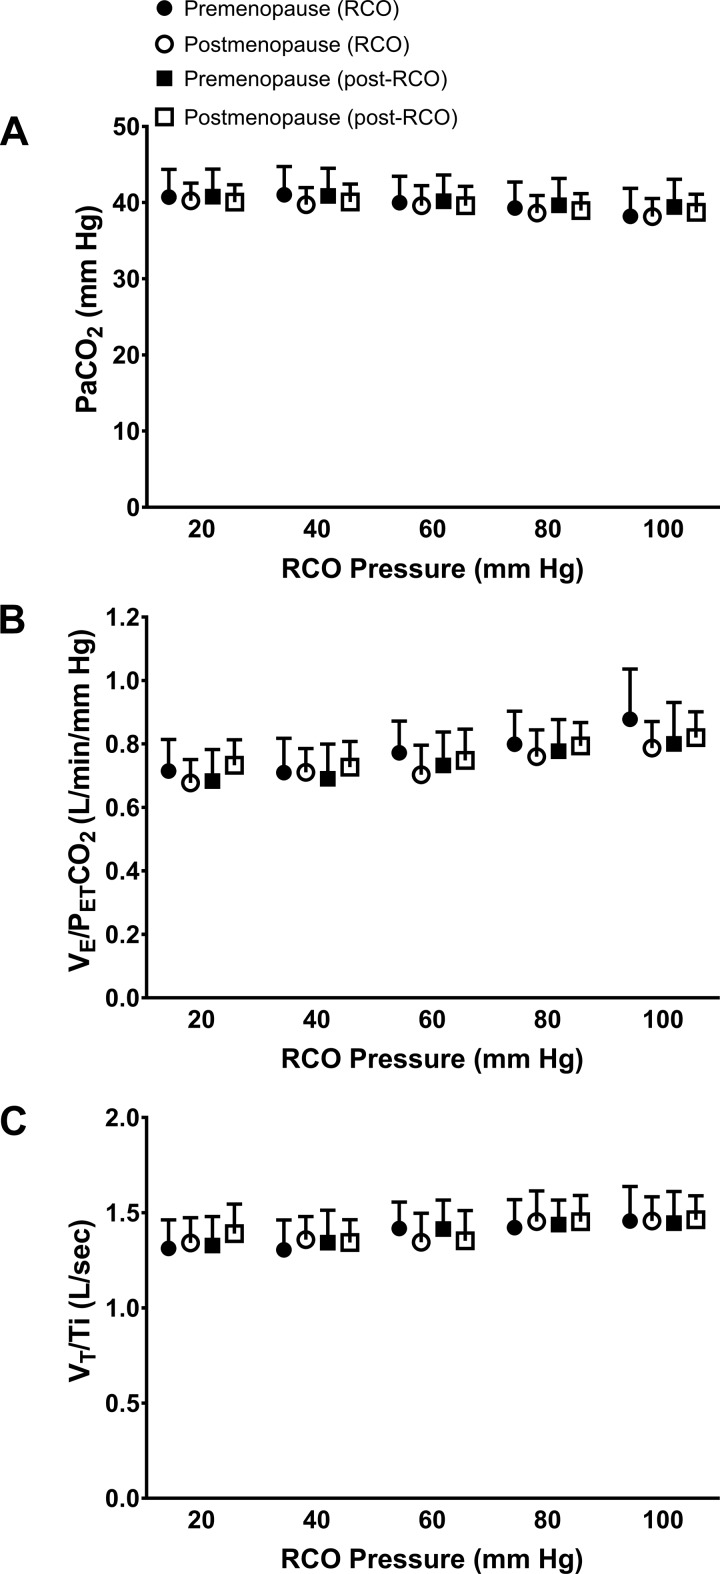
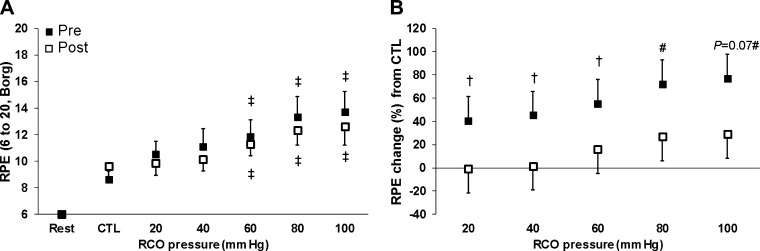
Although pathophysiological links between postmenopause and healthy aging remain unclear, both factors are associated with increased blood pressure and sympathetic nerve activity (SNA) in women. Activation of polymodal musculoskeletal neural afferents originating within adventia of venules modulates SNA and blood pressure control during exercise in healthy adults. We hypothesized transient subsystolic regional circulatory occlusion (RCO) during exercise sensitizes these afferents leading to augmented systemic vascular resistance (SVR)-mediated increased mean arterial pressure (MAP) in postmenopause vs. premenopause. Normotensive women in premenopause or postmenopause (n = 14 and 14; ages: 30 ± 9 and 55 ± 7 yr, respectively; P < 0.01) performed: 1) peak exercise testing and 2) fixed-load cycling at 30% peak workload (48 ± 11 and 38 ± 6 W, respectively; P < 0.01), whereby the initial 3 min were control exercise without RCO (CTL), thereafter including 2 min of bilateral-thigh RCO to 20, 40, 60, 80, or 100 mmHg (randomized), with 2 min deflation between RCO. Both MAP (17 ± 4 vs. 4 ± 4%, P = 0.02) and SVR (16 ± 8 vs. -3 ± 8%, P = 0.04) increased at 80 mmHg from CTL in postmenopause vs. premenopause, respectively. However, cardiac index was similar in postmenopause vs. premenopause at 80 mmHg from CTL (1 ± 6 vs. 7 ± 6%, respectively; P = 0.15). There was no continuous effect of aging in MAP (P = 0.12), SVR (P = 0.07), or cardiac index (P = 0.18) models. These data suggest transient locomotor subsystolic RCO sensitizes musculoskeletal afferents, which provoke increased SVR to generate augmented MAP during exercise in postmenopause. These observations provide a novel approach for understanding the age-independent variability in exercise blood pressure control across the normotensive adult pre- to postmenopause spectrum.
Keywords: aging women; cardiac output; exercise pressor reflex; group III-Aδ and IV-C neural afferents; regional circulatory occlusion.
Copyright © 2016 the American Physiological Society.
Figures
Similar articles
-
Combined influence of inspiratory loading and locomotor subsystolic cuff inflation on cardiovascular responses during submaximal exercise.J Appl Physiol (1985). 2020 May 1;128(5):1338-1345. doi: 10.1152/japplphysiol.00781.2019. Epub 2020 Apr 2. J Appl Physiol (1985). 2020. PMID: 32240016 Free PMC article.
-
Influence of sympathetic nerve activity on aortic hemodynamics and pulse wave velocity in women.Am J Physiol Heart Circ Physiol. 2017 Feb 1;312(2):H340-H346. doi: 10.1152/ajpheart.00447.2016. Epub 2016 Dec 6. Am J Physiol Heart Circ Physiol. 2017. PMID: 27923789 Free PMC article.
-
Effect of aging on hemodynamic response to metaboreflex activation.Eur J Appl Physiol. 2015 Aug;115(8):1693-703. doi: 10.1007/s00421-015-3153-5. Epub 2015 Mar 24. Eur J Appl Physiol. 2015. PMID: 25802227
-
Cardiovascular Control During Exercise: The Connectivity of Skeletal Muscle Afferents to the Brain.Exerc Sport Sci Rev. 2020 Apr;48(2):83-91. doi: 10.1249/JES.0000000000000218. Exerc Sport Sci Rev. 2020. PMID: 32000180 Review.
-
Sex, ageing and resting blood pressure: gaining insights from the integrated balance of neural and haemodynamic factors.J Physiol. 2012 May 1;590(9):2069-79. doi: 10.1113/jphysiol.2011.224642. Epub 2012 Feb 20. J Physiol. 2012. PMID: 22351633 Free PMC article. Review.
Cited by
-
Combined influence of inspiratory loading and locomotor subsystolic cuff inflation on cardiovascular responses during submaximal exercise.J Appl Physiol (1985). 2020 May 1;128(5):1338-1345. doi: 10.1152/japplphysiol.00781.2019. Epub 2020 Apr 2. J Appl Physiol (1985). 2020. PMID: 32240016 Free PMC article.
-
Influence of Sex, Menstrual Cycle, and Menopause Status on the Exercise Pressor Reflex.Med Sci Sports Exerc. 2019 May;51(5):874-881. doi: 10.1249/MSS.0000000000001877. Med Sci Sports Exerc. 2019. PMID: 30986812 Free PMC article. Review.
References
-
- Allison MA, Criqui MH, Wright CM. Patterns and risk factors for systemic calcified atherosclerosis. Arterioscler Thromb Vasc Biol 24: 331–336, 2004. - PubMed
-
- Bartels SA, Stok WJ, Bezemer R, Boksem RJ, van Goudoever J, Cherpanath TG, van Lieshout JJ, Westerhof BE, Karemaker JM, Ince C. Noninvasive cardiac output monitoring during exercise testing: Nexfin pulse contour analysis compared to an inert gas rebreathing method and respired gas analysis. J Clin Monit Comput 25: 315–321, 2011. - PubMed
-
- Batman BA, Hardy JC, Leuenberger UA, Smith MB, Yang QX, Sinoway LI. Sympathetic nerve activity during prolonged rhythmic forearm exercise. J Appl Physiol (1985) 76: 1077–1081, 1994. - PubMed
-
- Bos WJ, van den Meiracker AH, Wesseling KH, Schalekamp MA. Effect of regional and systemic changes in vasomotor tone on finger pressure amplification. Hypertension 26: 315–320, 1995. - PubMed
-
- Broch O, Renner J, Gruenewald M, Meybohm P, Schottler J, Caliebe A, Steinfath M, Malbrain M, Bein B. A comparison of the Nexfin (R) and transcardiopulmonary thermodilution to estimate cardiac output during coronary artery surgery. Anaesthesia 67: 377–383, 2012. - PubMed
Publication types
MeSH terms
Grants and funding
LinkOut - more resources
Full Text Sources
Other Literature Sources
Medical
Research Materials