. 2016 Oct 6:10:41.
doi: 10.3389/fninf.2016.00041. eCollection 2016.

Temporal Code-Driven Stimulation: Definition and Application to Electric Fish Signaling

Affiliations

Temporal Code-Driven Stimulation: Definition and Application to Electric Fish Signaling

Angel Lareo et al. Front Neuroinform. .

Abstract

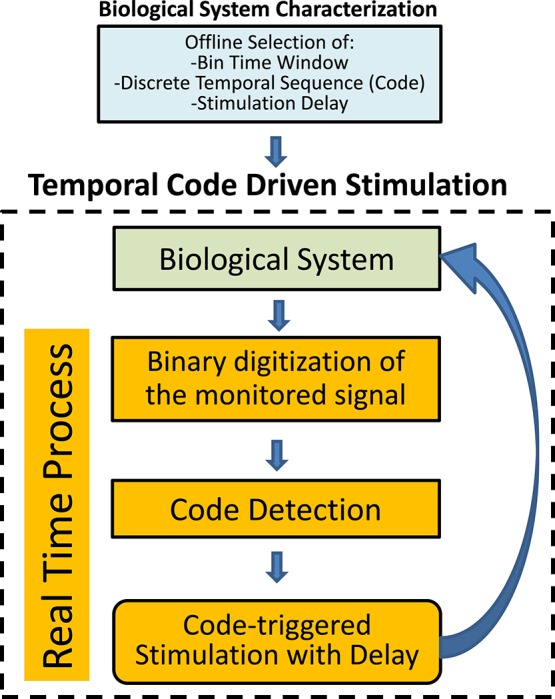
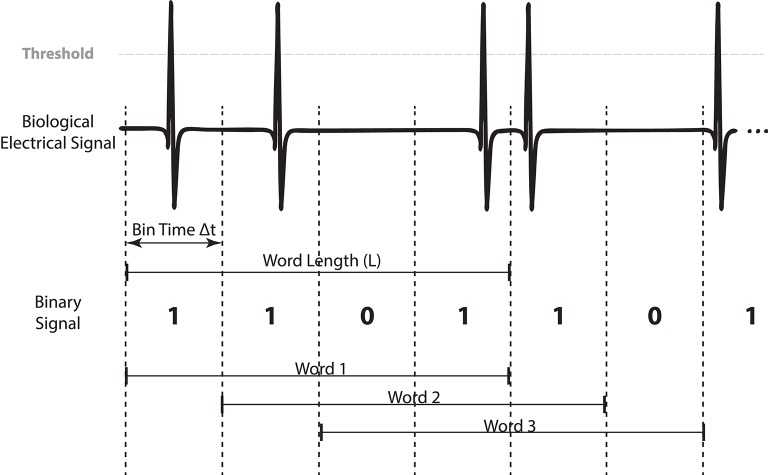
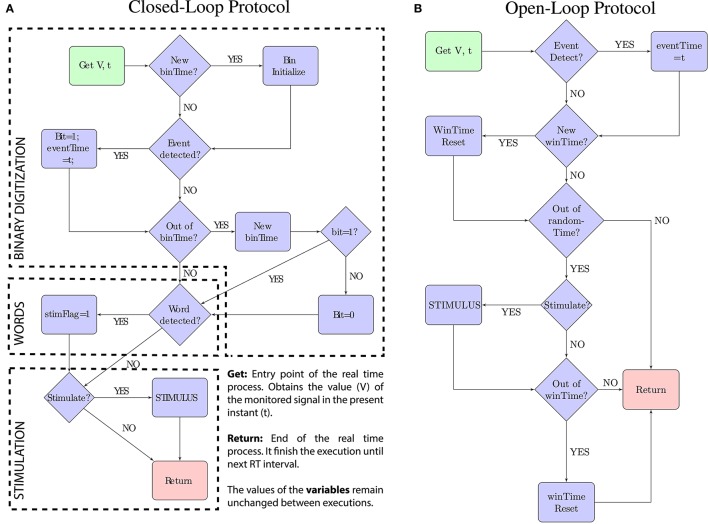
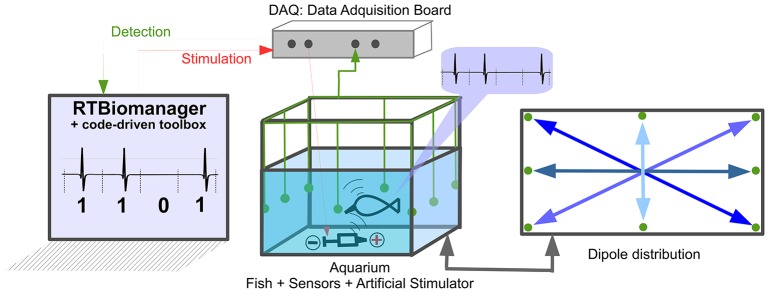
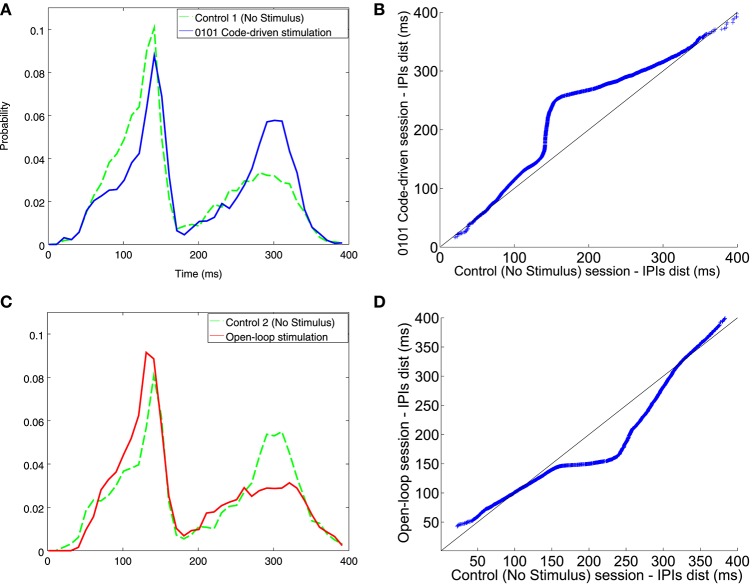
Closed-loop activity-dependent stimulation is a powerful methodology to assess information processing in biological systems. In this context, the development of novel protocols, their implementation in bioinformatics toolboxes and their application to different description levels open up a wide range of possibilities in the study of biological systems. We developed a methodology for studying biological signals representing them as temporal sequences of binary events. A specific sequence of these events (code) is chosen to deliver a predefined stimulation in a closed-loop manner. The response to this code-driven stimulation can be used to characterize the system. This methodology was implemented in a real time toolbox and tested in the context of electric fish signaling. We show that while there are codes that evoke a response that cannot be distinguished from a control recording without stimulation, other codes evoke a characteristic distinct response. We also compare the code-driven response to open-loop stimulation. The discussed experiments validate the proposed methodology and the software toolbox.

Keywords: computational biology; electric fish; information theory; neuroinformatics; signal processing.


Figures

Figure 1
Figure 1
Schematic representation of the closed-loop temporal code-driven stimulation. Preselection of the parameters is based on previous offline analysis of the system. The biological system signal is acquired, digitized to a binary sequence and words are detected in order to guide the stimulation function.
Figure 2
Figure 2
Binary digitization and word formation example (4 bits) from a generic biological signal where pulse events are detected. Bits are superimposed between words as we use a shift of 1 bit in order to get all possible words resulting from the signal.
Figure 3
Figure 3
Schematic representations of the real-time protocols. The code-driven closed-loop protocol is described by the scheme (A). The open-loop stimulation protocol used as a comparison is described by the scheme (B). In both, the green box represents the entry point and the red box represents the exit point. Each function is executed on every real-time interval (time = t) and starts acquiring the value of the monitored signal (V). The trigger “Stimulate?” in both protocols depends on the pulse-stimulus delay (fixed value or range) introduced as a parameter to the protocol.
Figure 4
Figure 4
Setup used for temporal code-driven stimulation in electric fish signaling experiments. The EODs were measured using four differential dipoles placed at medium depth in the tank, displayed forming an asterisk (see dipole distribution). The grounding electrode is also located in the aquarium. The signal from the dipoles was amplified (TL082 JFET-Input Dual Operational Amplifier with a gain approximately equal to: 91/2.2 ≈ 42), summed (LM741 Operational Amplifiers), squared(using AD633 Analog Multiplier) and then digitized at 17 Khz by a DAQ board (NI PCI-6251, National Instruments Corporation). Stimulation is generated by the same board and controlled in real time by software.
Figure 5
Figure 5
Entropy per bit of words distribution depending on the parameter values (Δt, L). We selected the parameters using a maximum entropy criterion. In this case Δt between 100 and 120 ms and L = 2.
Figure 6
Figure 6
Illustrative example of IPI histogram and qqplots resulting from experiments addressing temporal coding influence with minimal codes. The IPI histogram (A) represents the distribution of IPIs discharged during code-driven stimulation sessions with different words triggering the stimulation (1 solid line; 01 dashed line; 11 dotted line). IPIs, represented on the X axis, were in the range between 0 and 250 ms and the probability, represented in the Y axis, was normalized. The qqplots represented IPI distributions during pulse event (1) stimulation sessions vs. 2-bit code-driven stimulation sessions (01 B; 11 C). X = Y is the reference line. In the qqplot that represented IPIs during the stimulation session using pulses vs. IPIs during the 01 stimulation session (B) most of the points were above the reference line, thus indicating that IPIs discharged during the 01-session were larger than those from the 1-session. In the qqplot that represents IPIs during stimulation session using pulses vs. IPIs during 11 stimulation session (C), most of the points were below the reference black line, thus indicating that IPIs discharged during the 11-session were shorter than the 1-session, particularly in the range between 160 and 240 ms.
Figure 7
Figure 7
Illustrative examples of IPI histogram and qqplots for different codes (0101, A; 1001, B). The IPI histograms (top) represents IPIs discharged during the control session (solid line) and the code-driven stimulation session (dashed line). IPIs, represented on the X axis, were in the range between 0 and 400 ms and the probability, represented in the Y axis, was normalized. Qqplots (bottom) represent IPI distribution during control session vs. IPI distribution during code-driven stimulation sessions. The black line represents the reference line y = x. See an additional example in Figure S3.
Figure 8
Figure 8
Experimental protocol. Closed-loop (CL) and Open-loop (OL) sessions, represented in gray, were stimulation sessions. C (control) sessions, represented in white, were sessions where no stimulation was delivered. As IPI discharges of Gnathonemus petersii are highly variable, we assume as our baseline the control session before a stimulation session.
Figure 9
Figure 9
IPI histogram and qqplots resulting from executing the code-driven and the open-loop protocols, as compared to the control session. (A) IPIs discharged during the first control session (A dashed line) and the code-driven stimulation session (A solid line). (C) IPIs discharged during the second control session (C dashed line) and the open-loop stimulation session (C solid line). IPIs, represented on the X axis, were in the range between 0 and 400 ms and the probability, represented in the Y axis, was normalized. The qqplots represent the IPI distribution during control session vs. the IPI distribution during code-driven stimulation sessions (B) and open-loop sessions (D). In both qqplots the black line represents the reference line y = x. See an additional example in Figure S4.

Similar articles

Cited by

References

    1. Baker C. A., Kohashi T., Lyons-Warren A. M., Ma X., Carlson B. A. (2013). Multiplexed temporal coding of electric communication signals in mormyrid fishes. J. Exp. Biol. 216(Pt 13), 2365–2379. 10.1242/jeb.082289 - DOI - PMC - PubMed
    1. Bell C. C., Myers J. P., Russell C. J. (1974). Electric organ discharge patterns during dominance related behavioral displays ingnathonemus petersii (mormyridae). 92, 201–228. 10.1007/bf00694506 - DOI
    1. Benda J., Gollisch T., Machens C. K., Herz A. V. (2007). From response to stimulus: adaptive sampling in sensory physiology. Curr. Opin. Neurobiol. 17, 430–436. 10.1016/j.conb.2007.07.009 - DOI - PubMed
    1. Berényi A., Belluscio M., Mao D., Buzsáki G. (2012). Closed-loop control of epilepsy by transcranial electrical stimulation. Science 337, 735–737. 10.1126/science.1223154 - DOI - PMC - PubMed
    1. Brochini L., Carelli P. V., Pinto R. D. (2011). Single synapse information coding in intraburst spike patterns of central pattern generator motor neurons. J. Neurosci. 31, 12297–12306. 10.1523/JNEUROSCI.1568-11.2011 - DOI - PMC - PubMed

LinkOut - more resources