

Co-diversification of Enterococcus faecium Core Genomes and PBP5: Evidences of pbp5 Horizontal Transfer
- PMID: 27766095
- PMCID: PMC5053079
- DOI: 10.3389/fmicb.2016.01581
Co-diversification of Enterococcus faecium Core Genomes and PBP5: Evidences of pbp5 Horizontal Transfer
Abstract
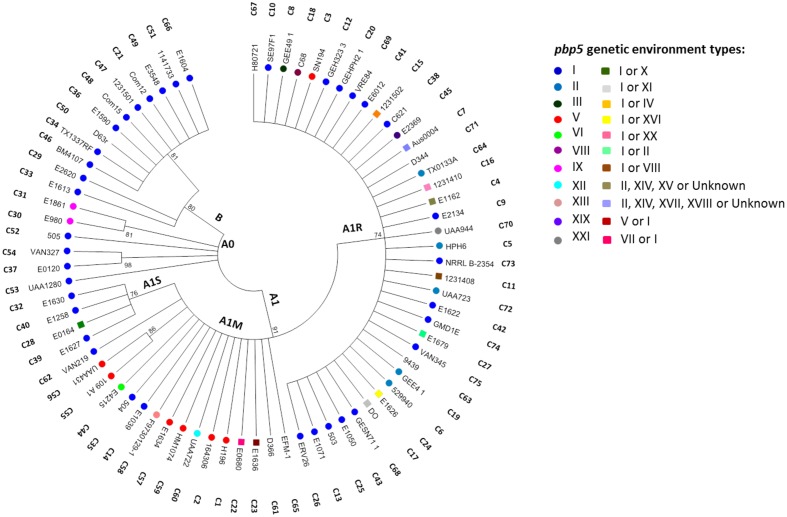
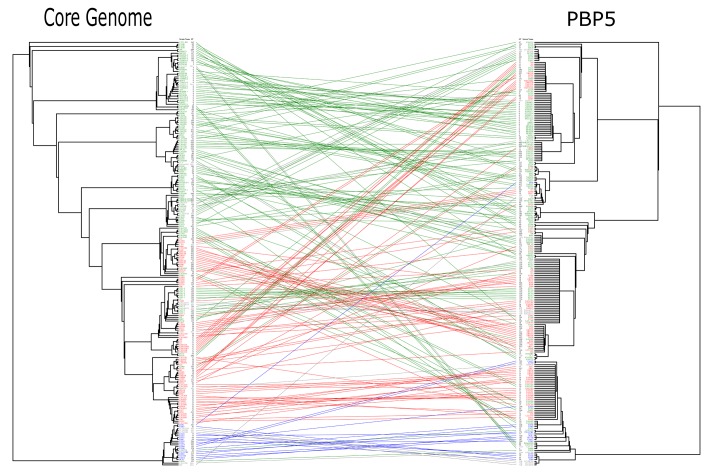
Ampicillin resistance has greatly contributed to the recent dramatic increase of a cluster of human adapted Enterococcus faecium lineages (ST17, ST18, and ST78) in hospital-based infections. Changes in the chromosomal pbp5 gene have been associated with different levels of ampicillin susceptibility, leading to protein variants (designated as PBP5 C-types to keep the nomenclature used in previous works) with diverse degrees of reduction in penicillin affinity. Our goal was to use a comparative genomics approach to evaluate the relationship between the diversity of PBP5 among E. faecium isolates of different phylogenomic groups as well as to assess the pbp5 transferability among isolates of disparate clonal lineages. The analyses of 78 selected E. faecium strains as well as published E. faecium genomes, suggested that the diversity of pbp5 mirrors the phylogenomic diversification of E. faecium. The presence of identical PBP5 C-types as well as similar pbp5 genetic environments in different E. faecium lineages and clones from quite different geographical and environmental origin was also documented and would indicate their horizontal gene transfer among E. faecium populations. This was supported by experimental assays showing transfer of large (≈180-280 kb) chromosomal genetic platforms containing pbp5 alleles, ponA (transglycosilase) and other metabolic and adaptive features, from E. faecium donor isolates to suitable E. faecium recipient strains. Mutation profile analysis of PBP5 from available genomes and strains from this study suggests that the spread of PBP5 C-types might have occurred even in the absence of a significant ampicillin resistance phenotype. In summary, genetic platforms containing pbp5 sequences were stably maintained in particular E. faecium lineages, but were also able to be transferred among E. faecium clones of different origins, emphasizing the growing risk of further spread of ampicillin resistance in this nosocomial pathogen.
Keywords: PBP5 mutations; PonA; ampicillin resistance; chromosomal transfer; phylogenomic diversification.
Figures
Similar articles
-
Differential Penicillin-Binding Protein 5 (PBP5) Levels in the Enterococcus faecium Clades with Different Levels of Ampicillin Resistance.Antimicrob Agents Chemother. 2016 Dec 27;61(1):e02034-16. doi: 10.1128/AAC.02034-16. Print 2017 Jan. Antimicrob Agents Chemother. 2016. PMID: 27821450 Free PMC article.
-
Enterococcus faecium low-affinity pbp5 is a transferable determinant.Antimicrob Agents Chemother. 2005 Dec;49(12):5007-12. doi: 10.1128/AAC.49.12.5007-5012.2005. Antimicrob Agents Chemother. 2005. PMID: 16304165 Free PMC article.
-
Genomic context as well as sequence of both psr and penicillin-binding protein 5 contributes to β-lactam resistance in Enterococcus faecium.mBio. 2024 May 8;15(5):e0017024. doi: 10.1128/mbio.00170-24. Epub 2024 Apr 2. mBio. 2024. PMID: 38564699 Free PMC article.
-
Intrinsic penicillin resistance in enterococci.Microb Drug Resist. 1996 Summer;2(2):209-13. doi: 10.1089/mdr.1996.2.209. Microb Drug Resist. 1996. PMID: 9158761 Review.
-
Resistance to β-lactams in enterococci.Rev Argent Microbiol. 2019 Apr-Jun;51(2):179-183. doi: 10.1016/j.ram.2018.01.007. Epub 2018 Sep 20. Rev Argent Microbiol. 2019. PMID: 30243525 Review.
Cited by
-
Antibiotic Resistance: Moving From Individual Health Norms to Social Norms in One Health and Global Health.Front Microbiol. 2020 Aug 28;11:1914. doi: 10.3389/fmicb.2020.01914. eCollection 2020. Front Microbiol. 2020. PMID: 32983000 Free PMC article. Review.
-
Antimicrobial Resistance in Enterococcus spp. of animal origin.Microbiol Spectr. 2018 Jul;6(4):10.1128/microbiolspec.arba-0032-2018. doi: 10.1128/microbiolspec.ARBA-0032-2018. Microbiol Spectr. 2018. PMID: 30051804 Free PMC article. Review.
-
Vancomycin Resistance in Enterococcus and Staphylococcus aureus.Microorganisms. 2022 Dec 21;11(1):24. doi: 10.3390/microorganisms11010024. Microorganisms. 2022. PMID: 36677316 Free PMC article. Review.
-
Linezolid- and Multidrug-Resistant Enterococci in Raw Commercial Dog Food, Europe, 2019-2020.Emerg Infect Dis. 2021 Aug;27(8):2221-2224. doi: 10.3201/eid2708.204933. Emerg Infect Dis. 2021. PMID: 34287135 Free PMC article.
-
β-Lactam Resistance in ESKAPE Pathogens Mediated Through Modifications in Penicillin-Binding Proteins: An Overview.Infect Dis Ther. 2023 Mar;12(3):829-841. doi: 10.1007/s40121-023-00771-8. Epub 2023 Mar 6. Infect Dis Ther. 2023. PMID: 36877435 Free PMC article. Review.
References
Grants and funding
LinkOut - more resources
Full Text Sources
Other Literature Sources