. 2016 May 17;2(5):625-647.
doi: 10.1016/j.jcmgh.2016.05.005. eCollection 2016 Sep.

Epithelial Regeneration After Gastric Ulceration Causes Prolonged Cell-Type Alterations

Affiliations

Epithelial Regeneration After Gastric Ulceration Causes Prolonged Cell-Type Alterations

Eitaro Aihara et al. Cell Mol Gastroenterol Hepatol. .

Abstract

Background & aims: The peptic ulcer heals through a complex process, although the ulcer relapse often occurs several years later after healing. Our hypothesis is that even after visual evidence of healing of gastric ulceration, the regenerated epithelium is aberrant for an extended interval, increasing susceptibility of the regenerated epithelium to damage and further diseases.

Methods: Gastric ulcers were induced in mice by serosal topical application of acetic acid.

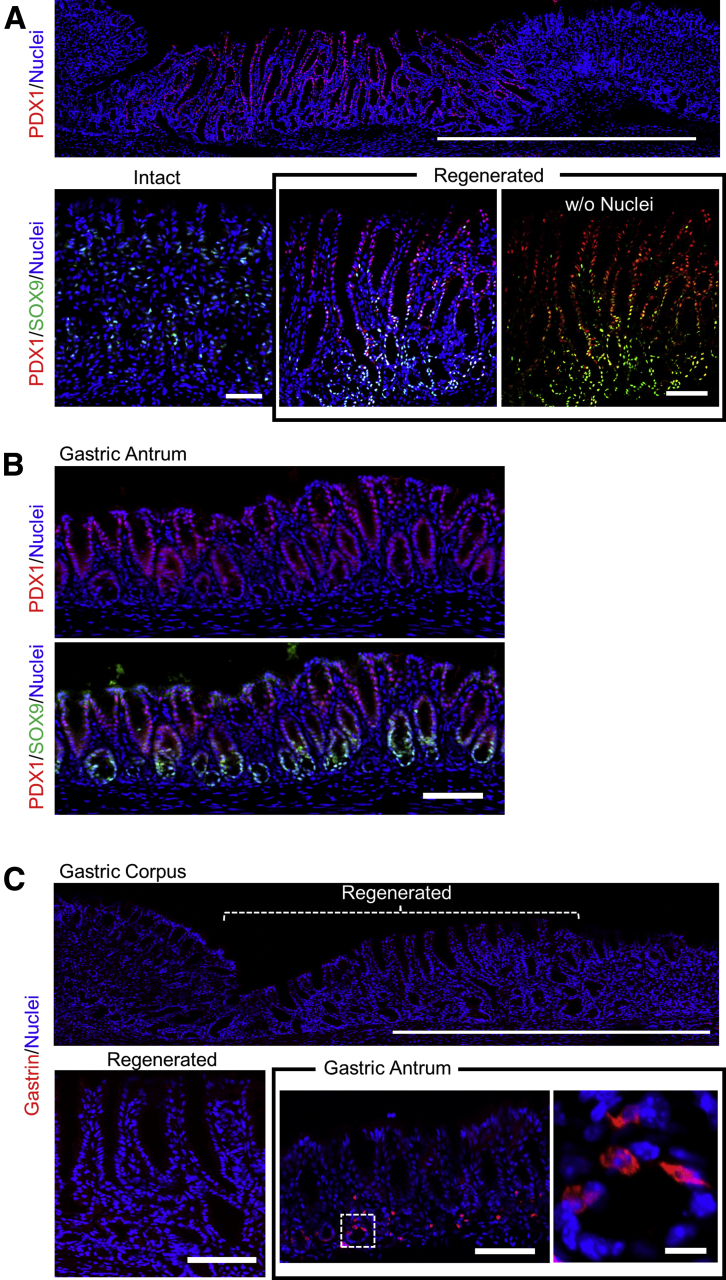
Results: Gastric ulcers induced by acetic acid visually healed within 30 days. However, regenerated epithelial architecture was poor. The gene profile of regenerated tissue was abnormal, indicating increased stem/progenitor cells, deficient differentiated gastric cell types, and deranged cell homeostasis. Despite up-regulation of PDX1 in the regenerated epithelium, no mature antral cell type was observed. Four months after healing, the regenerated epithelium lacks parietal cells, trefoil factor 2 (TFF2) and (sex-determining region Y)-box 9 (SOX9) remain up-regulated deep in the gastric gland, and the Na/H exchanger 2 (a TFF2 effector in gastric healing) remains down-regulated. Gastric ulcer healing was strongly delayed in TFF2 knockout mice, and re-epithelialization was accompanied with mucous metaplasia. After Helicobacter pylori inoculum 30 days after ulceration, we observed that the gastric ulcer selectively relapses at the same site where it originally was induced. Follow-up evaluation at 8 months showed that the relapsed ulcer was not healed in H pylori-infected tissues.

Conclusions: These findings show that this macroscopically regenerated epithelium has prolonged abnormal cell distribution and is differentially susceptible to subsequent damage by H pylori.

Keywords: CXCR4, C-X-C chemokine receptor type 4; DCLK1, doublecortin-like kinase 1; GAPDH, glyceraldehyde-3-phosphate dehydrogenase; GIF, gastric intrinsic factor; GSII, Griffonia simplicifolia lectin II; Gastric Ulcer Healing; H pylori; HK-ATPase, hydrogen potassium exchanger adenosine triphosphatase; KO, knockout; Lgr5, Leucine-rich repeat-containing G protein-coupled receptor5; MUC, Mucin; Metaplasia; NHE2; NHE2, sodium hydrogen exchanger 2; PCR, polymerase chain reaction; PDX1, pancreatic and duodenal homeobox 1; SOX2, (sex-determining region Y)-box 2; SOX9; SPEM, spasmolytic polypeptide-expressing metaplasia; TFF2; TFF2, trefoil factor 2; UEA-1, ulex europaeus; WT, wild type; cDNA, complementary DNA; mRNA, messenger RNA.


Conflict of interest statement

The remaining authors declare no conflict of interest.

Figures

Figure 1
Figure 1
Gastric regenerated epithelium in an acetic acid–induced ulcer mouse model. Gastric tissue was evaluated (A) 2 days or (B) 30 days after ulcer induction. Gross morphology with low resolution, high resolution of dotted rectangle on low-resolution image, and whole mount staining with HK-ATPase (red) and nuclei (Hoechst33342: cyan). Epithelium height was measured in an uninjured area (C, control) and a regenerated area (Re). *Significant difference at P < .05 vs control. Sections of gastric regenerated epithelium at experimental day 30 after ulceration. Images show (C) H&E staining, staining for HK-ATPase (HK: red) and cell nuclei (cyan), (D) H,K-ATPase (HK: red), and TFF2, or (E) NHE2 (green, bottom panel: high magnification of intact and regenerated epithelium, scale bar: 100 μm), nuclei (blue). Scale bar: 1 mm.
Figure 2
Figure 2
Gastric regenerated epithelium morphology at day 30. Gastric tissue was evaluated 30 days after ulcer induction. Gross appearance and (A) 3-dimensional (3D) image of regenerated epithelium stained with nuclei (Hoechst33342: green), and (B) 2-dimensional (2D) z-stack image. (C) Side view of 3D constricted image from regenerated epithelium indicated as white dotted rectangle in panel A.
Figure 3
Figure 3
Gastric marker expression in regenerated epithelium. Gastric intact epithelium and regenerated epithelium were isolated 30 days after ulcer induction. (A) Data show Western blot images of HK-ATPase (HK), GIF, TFF2, DCLK1, NHE2, SOX9, or GAPDH as indicated. (B) Compiled analysis of Western blots as in panel A, with results normalized to GAPDH. Results are presented as fold changes to intact epithelium, means ± SEM (N = 4). *Significant difference at P < .05 vs intact. Re, regenerated epithelium. Heat map of RNA expression of organ-specific markers, including (C) small intestine, gastric corpus, and gastric antrum, or (D) stem cell markers, in the ulcer regenerated epithelium. Data are represented as log2-transformed gene expression levels in the regenerated epithelium in comparison with the uninjured epithelium from the same mouse stomach (N = 3). *P < .05, **P < .005 vs uninjured tissue.
Figure 4
Figure 4
Mucous metaplasia in regenerated epithelium. Immunofluorescence was performed 30 days after acetic acid application. (A) Representative images show UEA-1 (green), GSII (red), and nuclei (Hoechst33342: blue). Scale bar: 1 mm. (B) Representative images show TFF2 (blue), UEA-1 (green), GSII (red), and nuclei (white) in the intact and regenerated epithelium. White arrows in TFF2 and UEA-1 indicate cells that are TFF2 positive but UEA-1 negative. Scale bar: 50 μm. (C) Representative images show GIF (green), UEA-1 (white), GSII (red), and nuclei (blue) in the intact and regenerated epithelium. Yellow arrows indicate cells that are GIF positive in the regenerated epithelium. Scale bar: 50 μm.
Figure 5
Figure 5
Proliferation zone and stem cells in the gastric regenerated epithelium. Gastric tissue was evaluated 30 days after ulcer induction. Sections of gastric regenerated epithelium were stained with (A) Ki67 and (B) SOX9. Top: Ki67 or SOX9 (green) and nuclei (Hoechst33342: red). Scale bar: 1 mm. In contrast, bottom: high magnification of Ki67 or SOX9 (green) co-stained with UEA-1 (white) and GSII (red) in the intact and regenerated epithelium. Scale bar: 100 μm. Sections of regenerated gastric epithelium were co-stained with (C) DCLK1 and HK-ATPase, (D) SOX9, or (E) Ki67. (C) Images show DCLK1 (green), HK-ATPase (HK: red), and nuclei (blue) in low magnification (left panel: scale bar: 1 mm) and high magnification of intact and regenerated epithelium (right panel: scale bar: 50 μm). Double staining for (D) DCLK (green) and SOX9 (red) or (E) Ki67 (red), and nuclei (blue) in the intact and regenerated epithelium. Scale bar: 50 μm.
Figure 6
Figure 6
Expression of SOX2 in regenerated epithelium. Immunofluorescence was performed 30 days after acetic acid application. Images show SOX2 (red), Ki67 (green) or SOX9 (green), and nuclei (Hoechst33342: blue) in the intact and regenerated epithelium. Scale bar: 50 μm.
Figure 7
Figure 7
Expression of UEA-1, GSII, Ki67, and SOX9 in the gastric antrum. (A) Sections of gastric antrum were stained with UEA-1 (green), GSII (red), and nuclei (Hoechst33342: blue). Scale bar: 100 μm. (B and C) Left: Ki67 or SOX9 (green) and nuclei (red), respectively; right: Ki67 or SOX9 (green) co-stained with UEA-1 (white) and GSII (red) in the sections of gastric antrum, respectively. Scale bar: 100 μm.
Figure 8
Figure 8
Expression of PDX1 in regenerated epithelium. Immunofluorescence was performed 30 days after acetic acid application. (A) Upper: PDX1 (red) and nuclei (Hoechst33342: blue). Scale bar: 1 mm. Lower: high magnification of PDX1 (red) co-stained with SOX9 (green) and nuclei (blue) in the intact and regenerated epithelium. Scale bar: 50 μm. (B) PDX1 (red) with SOX9 (green) and nuclei (blue) in gastric antrum. Scale bar: 100 μm. (C) Low (upper panel: scale bar: 1 mm) or high (lower panel: scale bar: 100 μm) magnification of gastrin (red) and nuclei (blue) staining in the regenerated epithelium. In addition, images show low (scale bar: 100 μm) or high (from dotted rectangle on low-resolution image, scale bar: 10 μm) resolution of gastrin (red) and nuclei (blue) expression in gastric antrum.
Figure 9
Figure 9
Gastric ulcer healing in TFF2 KO mouse. (A) Gastric tissue was evaluated at 9 or 30 days after ulcer induction. Gastric ulcer size was measured and data are presented as means ± SEM (N = 6). *Significant difference at P < .05 vs WT. (B) Sections of gastric intact epithelium or ulcer margin in TFF2 KO at day 9. Images show H&E staining and UEA-1 (green), GSII (red) and nuclei (Hoechst33342: blue). Scale bar: 100 μm. (C) Sections of gastric regenerated epithelium in TFF2 KO at day 30 were dual-stained for H,K-ATPase (HK: red) and TFF2 (green) or NHE2 (green), and UEA-1 (green) and GSII (red). Left panel: low magnification (scale bar: 1 mm), right panel: high magnification (scale bar: 100 μm).
Figure 10
Figure 10
Gastric epithelium in NHE2 KO mouse. Gastric tissue was obtained from WT and NHE2 KO mice. (A) Data show Western blot images of HK-ATPase (HK), TFF2, NHE2, SOX9, or GAPDH as indicated. (B) Compiled analysis of Western blots as in panel A, with results normalized to GAPDH. Results are presented as fold changes normalized to intact epithelium, means ± SEM (N = 4). *Significant difference at P < .05 vs WT. (C) Low- (left panel, scale bar: 1 mm) and high- (right panel, scale bar: 100 μm) magnification images of NHE2 KO mouse stomach, showing H&E, HK-ATPase (HK: red) and TFF2 (green), or UEA-1 (green) and GSII (red), respectively. (D) TFF2 (blue), UEA-1 (green), GSII (red), and nuclei (Hoechst33342: white) in NHE2 KO mouse stomach. Scale bar: 50 μm.
Figure 11
Figure 11
Gastric epithelium in NHE2 KO mouse. Immunofluorescence was performed in NHE2 KO mouse stomach. (A) Sections of NHE2 KO stomach were stained with SOX9 (green) and nuclei (Hoechst33342: red) or SOX9 (red), UEA-1 (white) and GSII (red). (B) DCLK1 (green), SOX9 (red), or (C) Ki67 (red), and (D) nuclei (blue), or PDX1 (red), SOX9 (green), and nuclei (blue). Scale bars: 50 μm.
Figure 12
Figure 12
Expression of SOX2 in NHE2 KO mouse stomach. Immunofluorescence was performed in NHE2 KO mouse stomach. Sections of NHE2 KO stomach were stained with (A) SOX2 (red), SOX9 (green), or (B) Ki67 (green), and nuclei (Hoechst33342: blue). Scale bars: 50 μm.
Figure 13
Figure 13
Gastric regenerated epithelium at long-term period, and ulcer relapse by H pylori. (A) Schematic of experimental timeline. A single gavage of 106H pylori was performed 30 days after ulcer induction. Gastric ulcer was evaluated at 14 days (44 days after ulceration), 3 months (4 months after ulceration), or 7 months (8 months after ulceration) after H pylori inoculation. (B) Gross morphology at each experimental time point after inoculation with 106H pylori. Control tissue was from mice uninfected with H pylori. (C) Gastric ulcer size was measured and data are presented as means ± SEM (N = 5–7). *Significant difference at P < .05 vs negative H pylori. (D) Harvested ulcer regenerated (u) or nonulcerated control (c) gastric tissue was collected from the same mouse, homogenized, and H pylori was cultured on Columbia blood agar plates to obtain colony-forming units (CFU). Data are presented as CFU/g tissue (N = 4). No CFU was detected in mice not infected with H pylori. (E) HK-ATPase, TFF2, NHE2, or SOX9 mRNA was detected by real-time PCR. Data are shown as fold change normalized to the nonulcerated region of the uninfected group (ulcer -, H pylori -). Means ± SEM (N = 5–7). *P < .05 vs intact region (ulcer -, H pylori -). #P < .05 vs ulcer region in no H pylori inoculation group (ulcer +, H pylori -).
Figure 14
Figure 14
Morphology of gastric regenerated epithelium at 4 months after ulceration. Gastric ulcer was induced by topical serosal application of acetic acid. In some animals, a single gavage of 106H pylori was performed 30 days after ulcer induction. Results are compared from the same tissue and sectioning series, although adjacent sections are not always presented. Sections of uninfected (control) or H pylori–infected tissues are used. Images show dual staining for HK-ATPase (HK: red) and TFF2 (green), HK-ATPase (HK: red) and NHE2 (green), or UEA-1 (green) and GSII (red), and triple staining for Ki67 or SOX9 (green) with UEA-1 (white) and GSII (red). Scale bar: 1 mm. For Ki67 and SOX9, high-magnification images of regenerated epithelium are shown in the yellow box. Scale bar: 100 μm.
Figure 15
Figure 15
Morphology of gastric regenerated epithelium at 8 months after ulceration. Gastric tissue was isolated 8 month after ulcer induction. Results are compared from the same tissue and sectioning series, although adjacent sections are not always presented. Sections of uninfected (control) or H pylori–infected tissues are used. Images show dual staining for HK-ATPase (HK: red) and TFF2 (green), HK-ATPase (HK: red) and NHE2 (green), or UEA-1 (green) and GSII (red), and triple staining for Ki67 or SOX9 (green) with UEA-1 (white) and GSII (red). Scale bar: 1 mm. For Ki67 and SOX9, high-magnification images of regenerated epithelium are shown in the yellow box. Scale bar: 100 μm.

References

    1. Okabe S., Amagase K. An overview of acetic acid ulcer models–the history and state of the art of peptic ulcer research. Biol Pharm Bull. 2005;28:1321–1341. - PubMed
    1. Wallace J.L. Prostaglandins, NSAIDs, and gastric mucosal protection: why doesn't the stomach digest itself? Physiol Rev. 2008;88:1547–1565. - PubMed
    1. Tarnawski A., Stachura J., Krause W.J. Quality of gastric ulcer healing: a new, emerging concept. J Clin Gastroenterol. 1991;13(Suppl 1):S42–S47. - PubMed
    1. Take S., Mizuno M., Ishiki K. The effect of eradicating Helicobacter pylori on the development of gastric cancer in patients with peptic ulcer disease. Am J Gastroenterol. 2005;100:1037–1042. - PubMed
    1. Take S., Mizuno M., Ishiki K. Seventeen-year effects of eradicating Helicobacter pylori on the prevention of gastric cancer in patients with peptic ulcer; a prospective cohort study. J Gastroenterol. 2015;50:638–644. - PubMed