. 2016 Oct 20;1(17):e88766.
doi: 10.1172/jci.insight.88766.

Insulin resistance uncoupled from dyslipidemia due to C-terminal PIK3R1 mutations

Affiliations

Insulin resistance uncoupled from dyslipidemia due to C-terminal PIK3R1 mutations

Isabel Huang-Doran et al. JCI Insight. .

Abstract

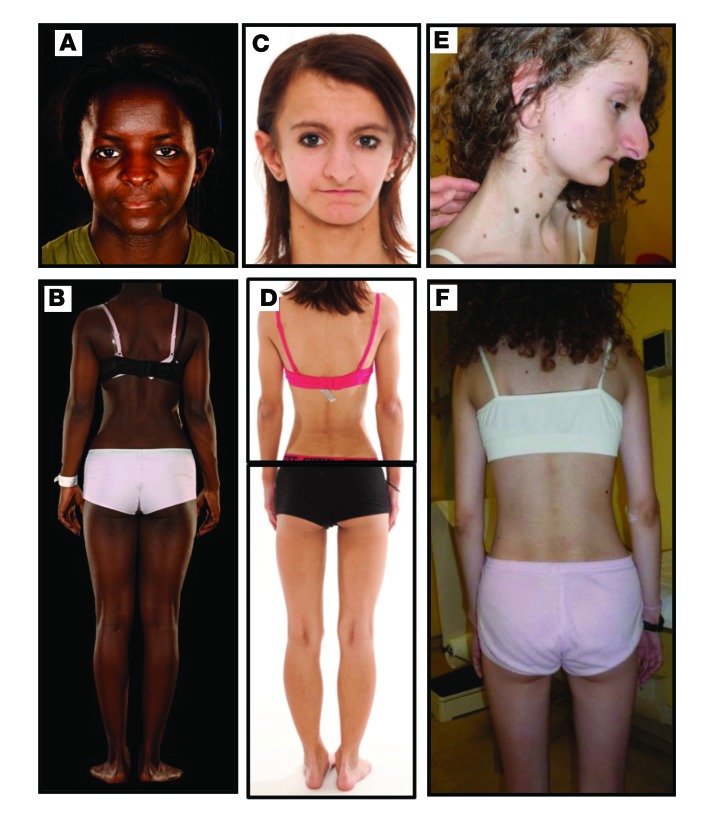
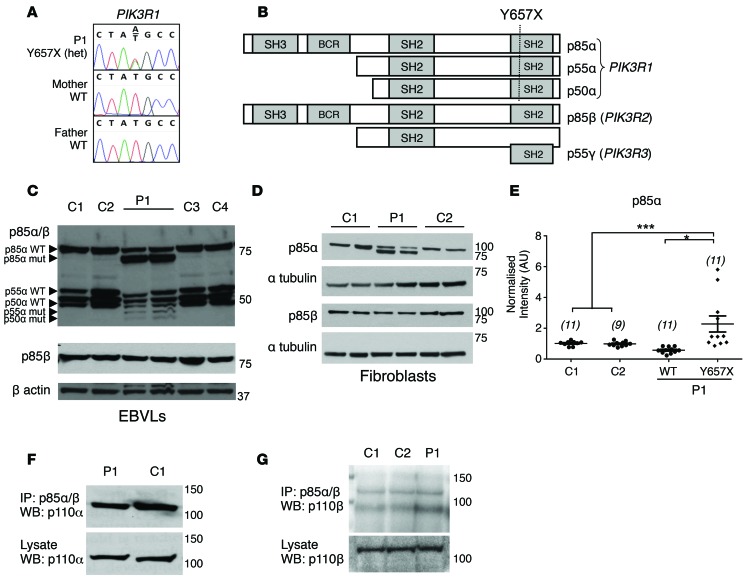
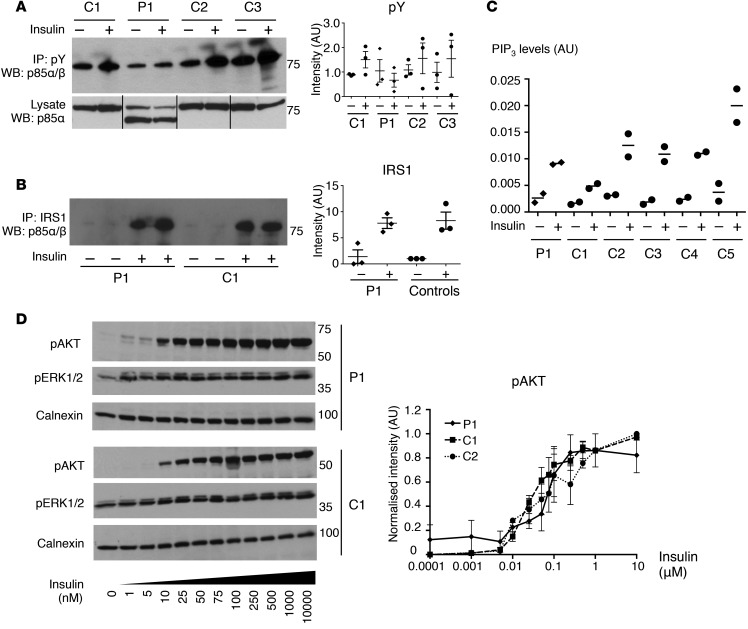
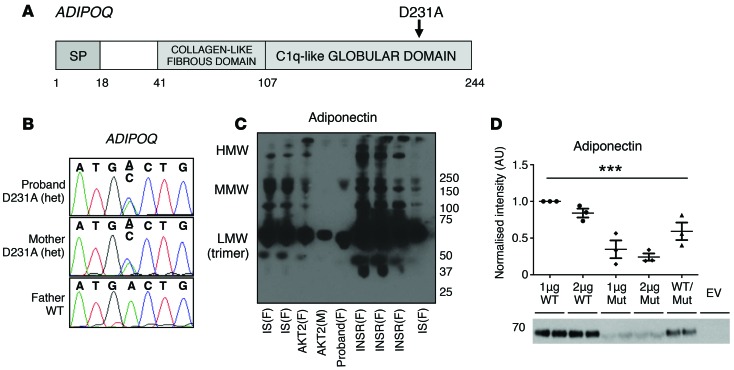
Obesity-related insulin resistance is associated with fatty liver, dyslipidemia, and low plasma adiponectin. Insulin resistance due to insulin receptor (INSR) dysfunction is associated with none of these, but when due to dysfunction of the downstream kinase AKT2 phenocopies obesity-related insulin resistance. We report 5 patients with SHORT syndrome and C-terminal mutations in PIK3R1, encoding the p85α/p55α/p50α subunits of PI3K, which act between INSR and AKT in insulin signaling. Four of 5 patients had extreme insulin resistance without dyslipidemia or hepatic steatosis. In 3 of these 4, plasma adiponectin was preserved, as in insulin receptor dysfunction. The fourth patient and her healthy mother had low plasma adiponectin associated with a potentially novel mutation, p.Asp231Ala, in adiponectin itself. Cells studied from one patient with the p.Tyr657X PIK3R1 mutation expressed abundant truncated PIK3R1 products and showed severely reduced insulin-stimulated association of mutant but not WT p85α with IRS1, but normal downstream signaling. In 3T3-L1 preadipocytes, mutant p85α overexpression attenuated insulin-induced AKT phosphorylation and adipocyte differentiation. Thus, PIK3R1 C-terminal mutations impair insulin signaling only in some cellular contexts and produce a subphenotype of insulin resistance resembling INSR dysfunction but unlike AKT2 dysfunction, implicating PI3K in the pathogenesis of key components of the metabolic syndrome.


Figures

Figure 1
Figure 1. Appearance of patients with severe insulin resistance and mutations in PIK3R1.
(A) Facial appearance of Patient 1 (P1) at 16 years old. (B) Posterior view of P1 showing absence of lipodystrophy. (C) Facial appearance of P2 aged 13 years old. (D) Composite posterior view of P2 showing lean build with generalized paucity of adipose tissue. (E) Facial view of P3 at 13 years old. (F) Posterior view of P3 showing lean build with generalized paucity of adipose tissue.
Figure 2
Figure 2. A de novo heterozygous nonsense mutation in PIK3R1 in a patient with severe insulin resistance.
(A) Genomic DNA sequence from patient 1 (P1) and her parents showing the de novo p.Tyr657X (Y657X) mutation in PIK3R1. (B) Domain structure of the protein products of PIK3R1 (p85α, p55α, and p50α) and predicted truncation site resulting from the nonsense mutation. (C) Full-length and truncated p85α, p55α, and p50α (indicated by arrowheads) and full-length p85β in EBV-transformed lymphoblastoid cells (EBVLs) from P1 and healthy controls (C1–C4), as assessed by Western blotting for total p85 (p85α/β) or p85β alone. (D) Expression of p85α or p85β in dermal fibroblasts from P1 and healthy controls (C1, C2). (E) Quantification of WT and mutant p85α expression in P1 and control fibroblasts from 4 independent Western blots, normalized to mean expression of WT p85α in controls. *P < 0.05, ***P < 0.005; 1-way ANOVA followed by post-hoc Tukey test. Total number of observations indicated in parentheses. Dot plot displays mean ± SEM. (F) Western blot of p110α after IP of total p85 in primary dermal fibroblast lysates. (G) Western blot of p110β after IP of total p85 in primary dermal fibroblast lysates.
Figure 3
Figure 3. Downstream insulin signaling in patient cells expressing truncated p85α.
(A) Western blot of total p85 (p85α/β) in phosphotyrosine immunoprecipitates or total lysates from dermal fibroblasts from P1 and healthy controls (C1–C3) treated with PBS or 100 nM insulin. Representative blots with quantified data from 3 independent experiments normalized to mean baseline intensity (dot plot displays mean ± SEM). Lane order in image of lysate blot adjusted to reflect that of the immunoprecipitate blot. (B) Western blot of total p85 (p85α/β) in phospho-IRS1 immunoprecipitates from patient and control fibroblasts after treatment with PBS or insulin. Representative blot with quantified data from three independent experiments normalized to mean baseline intensity across control cell lines. (C) Phosphatidylinositol-3,4,5-trisphosphate (PIP3) levels in dermal fibroblasts from P1 and healthy controls (C1–C5) stimulated with PBS or insulin, as determined by liquid chromatography mass spectroscopy. PIP3 area ratios were normalized to that of an internal standard. Dot plot displays median of 2 samples, each quantified in duplicate. Representative of 3 independent experiments. (D) Western blot of phosphorylated AKT1/2 (Ser473/474) and ERK1/2 (Thr202/Tyr204) in dermal fibroblasts from P1 and healthy controls (C1, C2) after stimulation with a range of insulin doses. Representative blots with quantified data from 3 independent experiments normalized to the highest intensity signal in each experiment and a calnexin loading control. Data represent mean ± SEM.
Figure 4
Figure 4. Insulin signaling and adipocyte differentiation in 3T3-L1 preadipocyte models of SHORT syndrome.
(A) Total p85 and p110α expression in preadipocyte lysates 72 hours after treatment with or without doxycycline (DOX) to induce expression of WT or mutant p85α. β Actin was assessed as a loading control. (B) Lipid accumulation, assessed by Oil red O staining on day 10 of an adipocyte differentiation protocol. Doxycycline was added at the time points indicated to inducibly overexpress full-length or truncated p85α. (C) Insulin-induced phosphorylation of AKT at Ser473/474 and Thr308 in preadipocytes infected with WT and mutant p85α lentivirus, with or without doxycycline treatment, after stimulation with 1, 10, or 100 nM insulin for 10 minutes. Representative of 3 independent experiments. (D) Quantification of AKT phosphorylation, showing pooled data from 3 independent experiments. –DOX and +DOX groups were compared using multiple t tests, with correction for multiple comparisons using the Holm-Šidák method, with α = 0.05. Data represent mean ± SEM; *P < 0.05.
Figure 5
Figure 5. A dominant negative mutation in ADIPOQ.
(A) Domain structure of adiponectin, with the approximate site of the p.Asp231Ala (D231A) substitution indicated. SP, signal peptide. (B) Genomic DNA sequence from P1 and her parents showing the D231A mutation in ADIPOQ. (C) Western blot of adiponectin in serum from P1, insulin-resistant controls with mutations in INSR or AKT2, and insulin-sensitive controls (IS), after non-denaturing, non-reducing SDS-PAGE. Representative of 3 independent experiments. Low- (LMW), medium- (MMW), and high-molecular-weight (HMW) adiponectin complexes are indicated. F, female; M, male. (D) Secretion of low-molecular-weight adiponectin complexes into the culture medium of HEK293-T cells transfected with 1 μg or 2 μg WT or mutant ADIPOQ or cotransfected with 1 μg WT and 1 μg mutant ADIPOQ, determined by non-denaturing, non-reducing SDS-PAGE, followed by Western blotting of adiponectin. Representative blot with quantified data from 3 independent experiments (n = 2 in each experiment), normalized to intensity of the 1 μg WT sample. Dot plot displays mean ± SEM. ***P < 0.005; 1-way ANOVA. EV, empty vector.

References

    1. Taniguchi CM, Emanuelli B, Kahn CR. Critical nodes in signalling pathways: insights into insulin action. Nat Rev Mol Cell Biol. 2006;7(2):85–96. - PubMed
    1. Reaven GM, Hoffman BB. A role for insulin in the aetiology and course of hypertension? Lancet. 1987;2(8556):435–437. - PubMed
    1. Shimomura I, Matsuda M, Hammer RE, Bashmakov Y, Brown MS, Goldstein JL. Decreased IRS-2 and increased SREBP-1c lead to mixed insulin resistance and sensitivity in livers of lipodystrophic and ob/ob mice. Mol Cell. 2000;6(1):77–86. doi: 10.1016/S1097-2765(05)00010-9. - DOI - PubMed
    1. Cusi K, et al. Insulin resistance differentially affects the PI 3-kinase- and MAP kinase-mediated signaling in human muscle. J Clin Invest. 2000;105(3):311–320. doi: 10.1172/JCI7535. - DOI - PMC - PubMed
    1. Hellerstein MK, Schwarz JM, Neese RA. Regulation of hepatic de novo lipogenesis in humans. Annu Rev Nutr. 1996;16:523–557. doi: 10.1146/annurev.nu.16.070196.002515. - DOI - PubMed

Publication types

Substances