. 2016 Dec 13;12(12):6201-6212.
doi: 10.1021/acs.jctc.6b00819. Epub 2016 Nov 7.

Simultaneous Optimization of Biomolecular Energy Functions on Features from Small Molecules and Macromolecules

Affiliations

Simultaneous Optimization of Biomolecular Energy Functions on Features from Small Molecules and Macromolecules

Hahnbeom Park et al. J Chem Theory Comput. .

Abstract

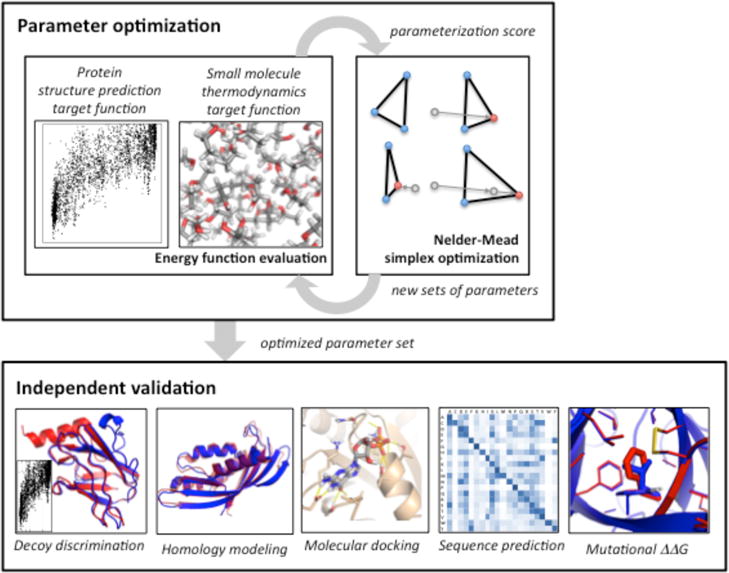
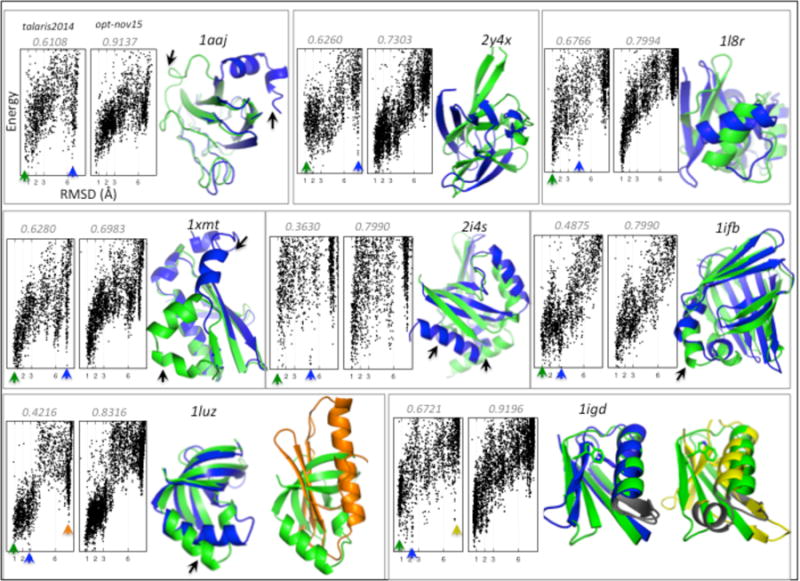
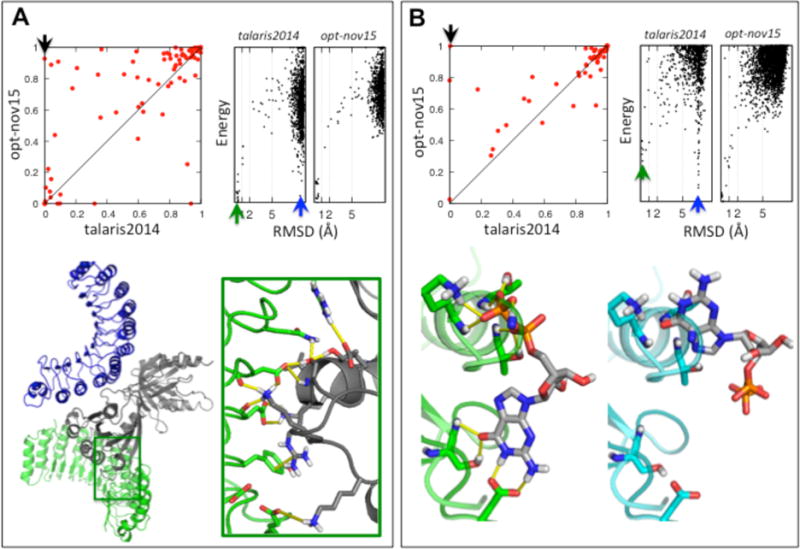
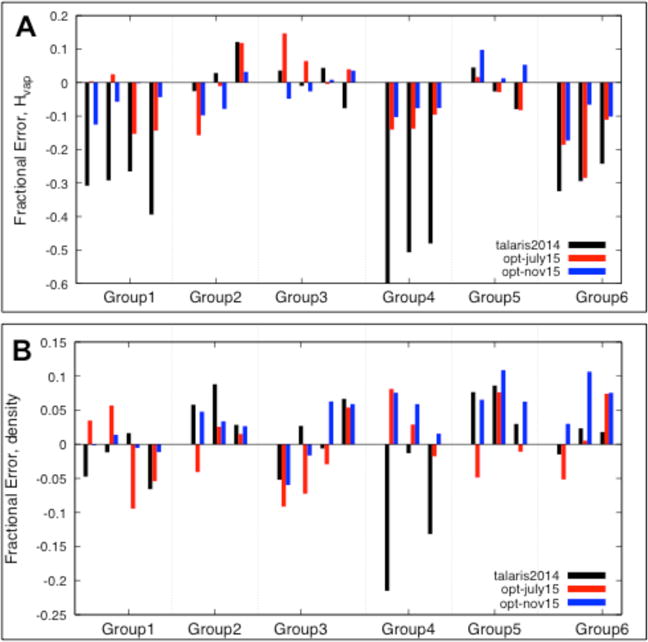
Most biomolecular modeling energy functions for structure prediction, sequence design, and molecular docking have been parametrized using existing macromolecular structural data; this contrasts molecular mechanics force fields which are largely optimized using small-molecule data. In this study, we describe an integrated method that enables optimization of a biomolecular modeling energy function simultaneously against small-molecule thermodynamic data and high-resolution macromolecular structural data. We use this approach to develop a next-generation Rosetta energy function that utilizes a new anisotropic implicit solvation model, and an improved electrostatics and Lennard-Jones model, illustrating how energy functions can be considerably improved in their ability to describe large-scale energy landscapes by incorporating both small-molecule and macromolecule data. The energy function improves performance in a wide range of protein structure prediction challenges, including monomeric structure prediction, protein-protein and protein-ligand docking, protein sequence design, and prediction of the free energy changes by mutation, while reasonably recapitulating small-molecule thermodynamic properties.


Conflict of interest statement

Notes

The authors declare no competing financial interest.

Figures

Figure 1
Figure 1
A graphical overview of the parameter optimization procedure.
Figure 2
Figure 2
Improvements in monomeric structure prediction from independent tests. In each scatter plot, a dot above diagonal line indicates improvement to a target. A) Decoy discrimination test. On the left, Boltzmann-weighted discrimination values are compared between talaris2014 (X-axis) and opt-nov15 (Y-axis) on 64 protein targets from validation set 2. B) Parallel loophash sampling (PLS) test. Boltzmann-weighted discrimination values are compared between talaris2014 (X-axis) and opt-nov15 (Y-axis) on 36 protein targets. C) Improved homology modeling on 69 CAMEO targets using RosettaCM. A comparison of homology model global distance test — high accuracy (GDT-HA) from talaris2014 (X-axis) and opt-nov15 is shown on the left. GDT-HA is a measure of agreement (in %) of a model to its native structure in high-resolution. An example of highlight target is shown on the right (pointed out as black arrow): the structures generated and selected by talaris2014 (magenta) and opt-nov15 (blue) are overlaid on native (green) structure.
Figure 3
Figure 3
Examples of proteins with successful recapitulation of energy landscapes. 8 cases from decoy discrimination set2 are shown (labeled in Figure 2A). For each case, energy landscapes by talaris2014 and opt-nov15 are shown on the left, talaris2014 on left and opt-nov15 on right; at top of it Boltzmann-weighted discrimination values are shown with gray italic text. Each point in the energy landscape plots indicates a particular protein conformation, with the X-axis indicating the structural deviation from the native conformation, and the Y-axis indicating energy; in a good energy landscape the lowest energy conformations have lowest structural deviation. On the right, comparisons of conformations are shown with different colors: the near-native conformation in green, and low-energy false conformations in blue or orange. Energy values and RMSD for these conformations are shown as arrows with corresponding colors on the energy landscape.
Figure 4
Figure 4
Improvements in docking energy landscape recovery from independent tests. In each scatter plot, a dot above diagonal line means improvement to a target. A) Protein-protein docking and B) protein-ligand docking. In each panel, a scatter plot of the Boltzmann-weighted discrimination values for targets are plotted on the top left; an example energy landscape is shown in the top right, talaris2014 on left and opt-nov15 on right; and the corresponding structure pointed out as black arrow is on the bottom. A) Protein receptor is colored in gray, and alternative conformations of the partners are colored in green (near-native) or blue (false conformer). Favorable native interactions are highlighted in the inset. B) Ligands are colored in gray, and protein in green or cyan.
Figure 5
Figure 5
Our optimized energy function reasonably recapitulates thermodynamic liquid properties of small molecules. A, B) Fractional errors in heat of vaporization (A) and density (B). Negative values indicate underestimation of reference experimental value, and positive overestimation. Colors indicate the energy function used: talaris2014 (black), opt-july15 (red), and opt-nov15 (blue). Each bar corresponds to a small molecule in Figures S3. Most of the molecules represent functional groups in natural amino acids: aliphatic (Group 1), aromatic (Group 2), alcohol (Group 3), sulfide or thiol (Group 4), and amide (Group 5); several polar molecules contain functional groups not found in natural amino acids (Group 6).

References

    1. Wang RY-R, Kudryashev M, Li X, Egelman EH, Basler M, Cheng Y, Baker D, DiMaio F. Nat Methods. 2015;12(4):335–338. - PMC - PubMed
    1. Song Y, DiMaio F, Wang RY-R, Kim D, Miles C, Brunette T, Thompson J, Baker D. Structure. 2013;21(10):1735–1742. - PMC - PubMed
    1. Ovchinnikov S, Park H, Kim DE, Liu Y, Yu-Ruei Wang R, Baker D. Proteins. 2016;84(S1):181–188. - PMC - PubMed
    1. Kamisetty H, Ovchinnikov S, Baker D. Proc Natl Acad Soc. 2013;110(39):15674–15679. - PMC - PubMed
    1. Lyskov S, Gray JJ. Nucleic Acids Res. 2008;36:W233–W238. Web Server issue. - PMC - PubMed