

Angiopoietin-2 attenuates angiotensin II-induced aortic aneurysm and atherosclerosis in apolipoprotein E-deficient mice
- PMID: 27767064
- PMCID: PMC5073347
- DOI: 10.1038/srep35190
Angiopoietin-2 attenuates angiotensin II-induced aortic aneurysm and atherosclerosis in apolipoprotein E-deficient mice
Abstract
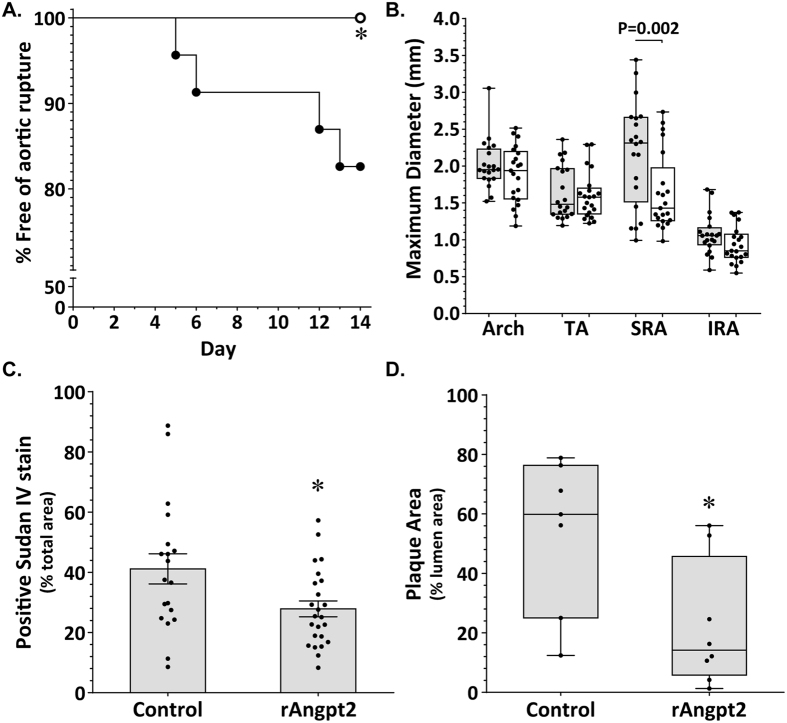
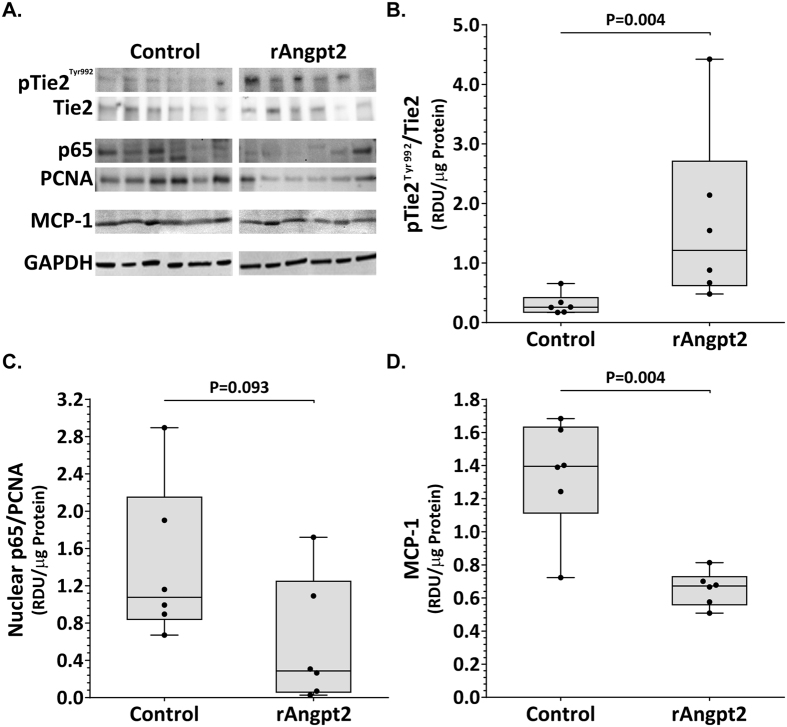
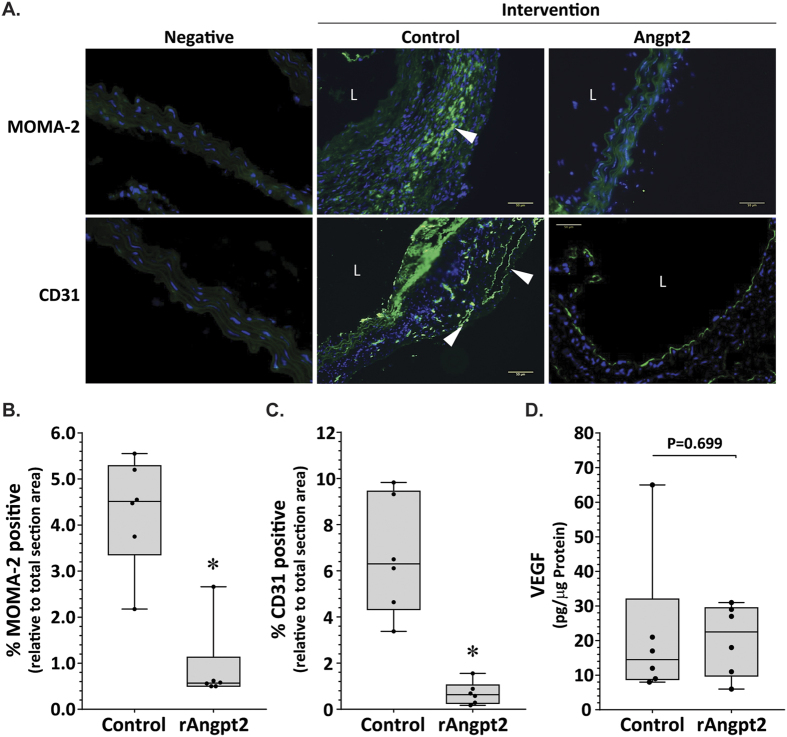
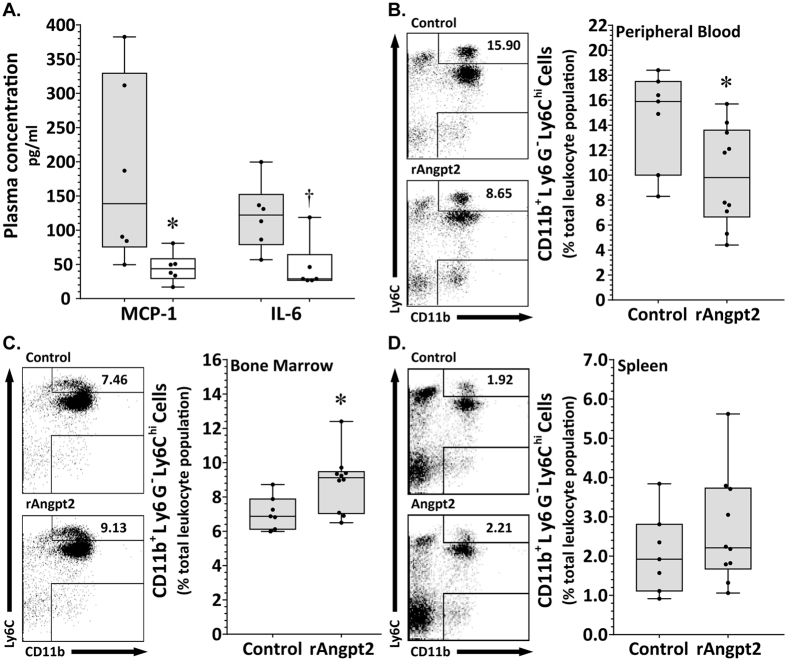
Angiogenesis and inflammation are implicated in aortic aneurysm and atherosclerosis and regulated by angiopoietin-2 (Angpt2). The effect of Angpt2 administration on experimental aortic aneurysm and atherosclerosis was examined. Six-month-old male apolipoprotein E deficient (ApoE-/-) mice were infused with angiotensin II (AngII) and administered subcutaneous human Fc-protein (control) or recombinant Angpt2 (rAngpt2) over 14 days. Administration of rAngpt2 significantly inhibited AngII-induced aortic dilatation and rupture of the suprarenal aorta (SRA), and development of atherosclerosis within the aortic arch. These effects were blood pressure and plasma lipoprotein independent and associated with Tie2 activation and down-regulation of monocyte chemotactic protein-1 (MCP-1) within the SRA. Plasma concentrations of MCP-1 and interleukin-6 were significantly lower in mice receiving rAngpt2. Immunostaining for the monocyte/macrophage marker MOMA-2 and the angiogenesis marker CD31 within the SRA were less in mice receiving rAngpt2 than controls. The percentage of inflammatory (Ly6Chi) monocytes within the bone marrow was increased while that in peripheral blood was decreased by rAngpt2 administration. In conclusion, administration of rAngpt2 attenuated angiotensin II-induced aortic aneurysm and atherosclerosis in ApoE-/- mice associated with reduced aortic inflammation and angiogenesis. Up-regulation of Angpt2 may have potential therapeutic value in patients with aortic aneurysm and atherosclerosis.
Figures
Similar articles
-
Mas receptor deficiency augments angiotensin II-induced atherosclerosis and aortic aneurysm ruptures in hypercholesterolemic male mice.J Vasc Surg. 2019 Nov;70(5):1658-1668.e1. doi: 10.1016/j.jvs.2018.11.045. Epub 2019 Mar 6. J Vasc Surg. 2019. PMID: 30850299 Free PMC article.
-
Cilostazol Attenuates Angiotensin II-Induced Abdominal Aortic Aneurysms but Not Atherosclerosis in Apolipoprotein E-Deficient Mice.Arterioscler Thromb Vasc Biol. 2018 Apr;38(4):903-912. doi: 10.1161/ATVBAHA.117.309707. Epub 2018 Feb 8. Arterioscler Thromb Vasc Biol. 2018. PMID: 29437572
-
Chinese red yeast rice attenuates the development of angiotensin II-induced abdominal aortic aneurysm and atherosclerosis.J Nutr Biochem. 2012 Jun;23(6):549-56. doi: 10.1016/j.jnutbio.2011.02.011. Epub 2011 Jul 20. J Nutr Biochem. 2012. PMID: 21764282
-
Leukocyte Calpain Deficiency Reduces Angiotensin II-Induced Inflammation and Atherosclerosis But Not Abdominal Aortic Aneurysms in Mice.Arterioscler Thromb Vasc Biol. 2016 May;36(5):835-45. doi: 10.1161/ATVBAHA.116.307285. Epub 2016 Mar 10. Arterioscler Thromb Vasc Biol. 2016. PMID: 26966280 Free PMC article.
-
Role of Serum Amyloid A in Abdominal Aortic Aneurysm and Related Cardiovascular Diseases.Biomolecules. 2021 Dec 15;11(12):1883. doi: 10.3390/biom11121883. Biomolecules. 2021. PMID: 34944527 Free PMC article. Review.
Cited by
-
Dickkopf1 destabilizes atherosclerotic plaques and promotes plaque formation by inducing apoptosis of endothelial cells through activation of ER stress.Cell Death Dis. 2017 Jul 13;8(7):e2917. doi: 10.1038/cddis.2017.277. Cell Death Dis. 2017. PMID: 28703797 Free PMC article.
-
Tissue-specific epigenetics of atherosclerosis-related ANGPT and ANGPTL genes.Epigenomics. 2019 Feb;11(2):169-186. doi: 10.2217/epi-2018-0150. Epub 2019 Jan 28. Epigenomics. 2019. PMID: 30688091 Free PMC article.
-
Decreased angiogenesis as a possible pathomechanism in cervical degenerative myelopathy.Sci Rep. 2021 Jan 28;11(1):2497. doi: 10.1038/s41598-021-81766-8. Sci Rep. 2021. PMID: 33510227 Free PMC article. Clinical Trial.
-
Angiogenesis in Aortic Aneurysm and Dissection: A Literature Review.Rev Cardiovasc Med. 2023 Aug 1;24(8):223. doi: 10.31083/j.rcm2408223. eCollection 2023 Aug. Rev Cardiovasc Med. 2023. PMID: 39076698 Free PMC article. Review.
-
Angiotensin II Type 1 Receptor-associated Protein Inhibits Angiotensin II-induced Insulin Resistance with Suppression of Oxidative Stress in Skeletal Muscle Tissue.Sci Rep. 2018 Feb 12;8(1):2846. doi: 10.1038/s41598-018-21270-8. Sci Rep. 2018. PMID: 29434287 Free PMC article.
References
-
- Golledge J., Muller J., Daugherty A. & Norman P. Abdominal aortic aneurysm: Pathogenesis and implications for management. Arterioscler. Thromb. Vasc. Biol. 26, 2605–2613 (2006). - PubMed
-
- Golledge J. & Norman P. E. Current status of medical management for abdominal aortic aneurysm. Atherosclerosis. 217, 57–63 (2011). - PubMed
-
- Reed D., Reed C., Stemmermann G. & Hayashi T. Are aortic aneurysms caused by atherosclerosis? Circulation. 85, 205–211 (1992). - PubMed
-
- Imhof B. A. & Aurrand-Lions M. Angiogenesis and inflammation face off. Nat. Med. 12, 171–172 (2006). - PubMed
Publication types
MeSH terms
Substances
LinkOut - more resources
Full Text Sources
Other Literature Sources
Medical
Research Materials
Miscellaneous
