

Wireless inertial measurement of head kinematics in freely-moving rats
- PMID: 27767085
- PMCID: PMC5073323
- DOI: 10.1038/srep35689
Wireless inertial measurement of head kinematics in freely-moving rats
Abstract
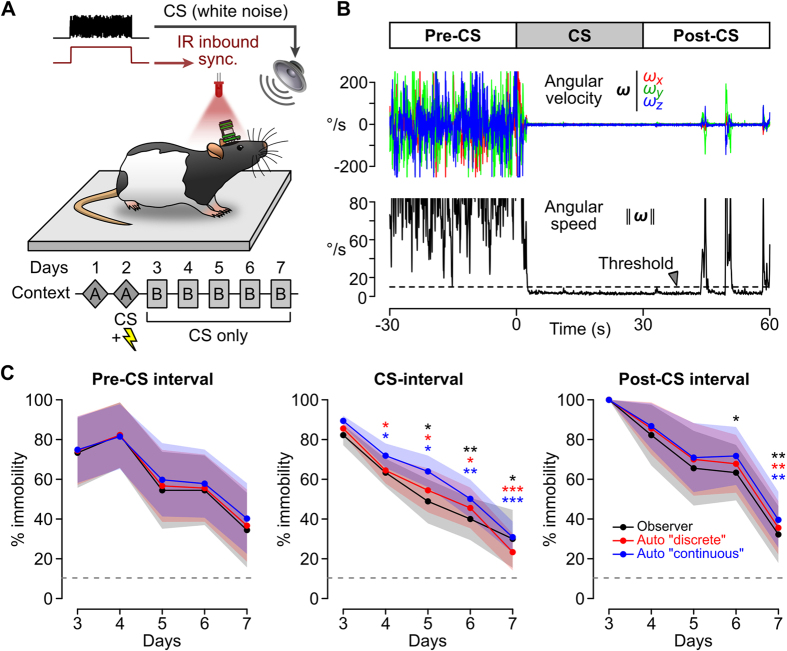
While miniature inertial sensors offer a promising means for precisely detecting, quantifying and classifying animal behaviors, versatile inertial sensing devices adapted for small, freely-moving laboratory animals are still lacking. We developed a standalone and cost-effective platform for performing high-rate wireless inertial measurements of head movements in rats. Our system is designed to enable real-time bidirectional communication between the headborne inertial sensing device and third party systems, which can be used for precise data timestamping and low-latency motion-triggered applications. We illustrate the usefulness of our system in diverse experimental situations. We show that our system can be used for precisely quantifying motor responses evoked by external stimuli, for characterizing head kinematics during normal behavior and for monitoring head posture under normal and pathological conditions obtained using unilateral vestibular lesions. We also introduce and validate a novel method for automatically quantifying behavioral freezing during Pavlovian fear conditioning experiments, which offers superior performance in terms of precision, temporal resolution and efficiency. Thus, this system precisely acquires movement information in freely-moving animals, and can enable objective and quantitative behavioral scoring methods in a wide variety of experimental situations.
Figures
 ,
,  ,
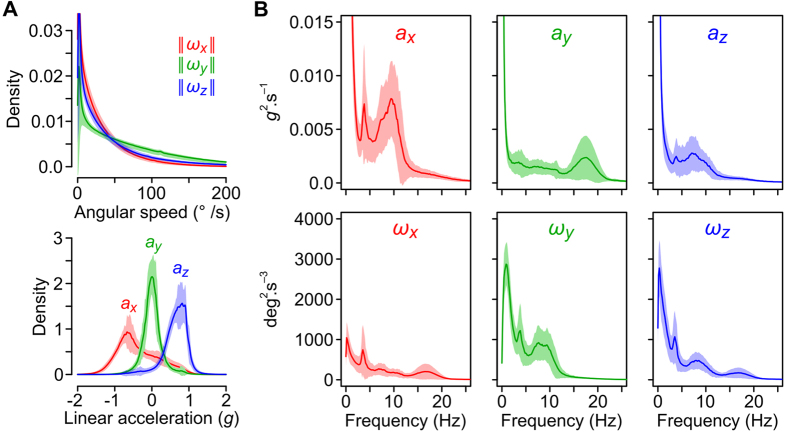
,  ). Bottom: average density histogram of the head linear accelerations. The different mean values of ax, ay and az reflect the influence of gravity. (B) Average power spectral density histograms for accelerometer and gyroscope data. Average histograms in (A,B) were calculated from 19 rats.
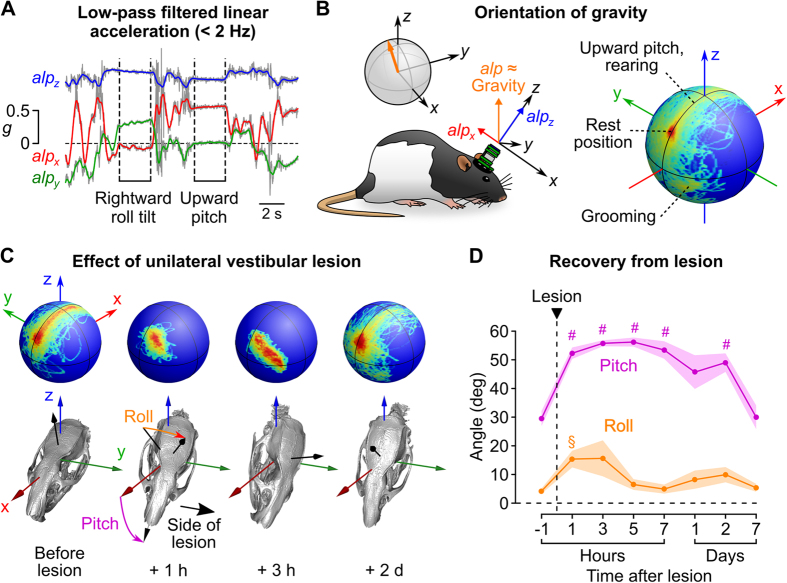
References
-
- Shull P. B., Jirattigalachote W., Hunt M. A., Cutkosky M. R. & Delp S. L. Quantified self and human movement: a review on the clinical impact of wearable sensing and feedback for gait analysis and intervention. Gait & posture 40(1), 11–19 (2014). - PubMed
-
- Wong W. Y., Wong M. S. & Lo K. H. Clinical applications of sensors for human posture and movement analysis: a review. Prosthetics and orthotics international 31(1), 62–75 (2007). - PubMed
-
- Culhane K. M., O’Connor M., Lyons D. & Lyons G. M. Accelerometers in rehabilitation medicine for older adults. Age and ageing 34(6), 556–560 (2005). - PubMed
-
- Lieber B., Taylor B., Appelboom G., McKhann G. & Connolly E. S. Motion Sensors to Assess and Monitor Medical and Surgical Management of Parkinson’s Disease. World neurosurgery 84(2), 561–566 (2015). - PubMed
-
- Li Q. et al.. Accurate, Fast Fall Detection Using Gyroscopes and Accelerometer-Derived Posture Information. IEEE International Workshop on Wearable and Implantable Body Sensor Networks (2009).
Publication types
MeSH terms
LinkOut - more resources
Full Text Sources
Other Literature Sources
