Comparative Study
. 2016 Dec 6;7(49):81099-81109.
doi: 10.18632/oncotarget.12752.

Is senescence-associated β-galactosidase a marker of neuronal senescence?

Affiliations
Comparative Study

Is senescence-associated β-galactosidase a marker of neuronal senescence?

Malgorzata Piechota et al. Oncotarget. .

Abstract

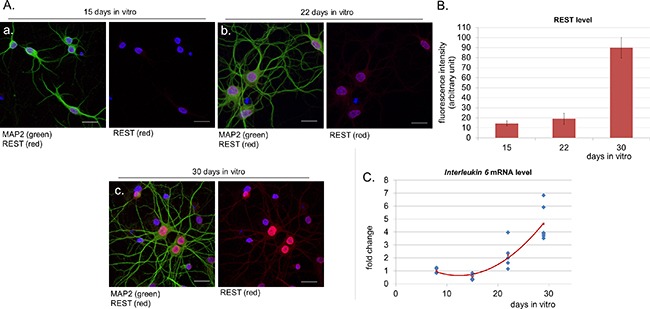
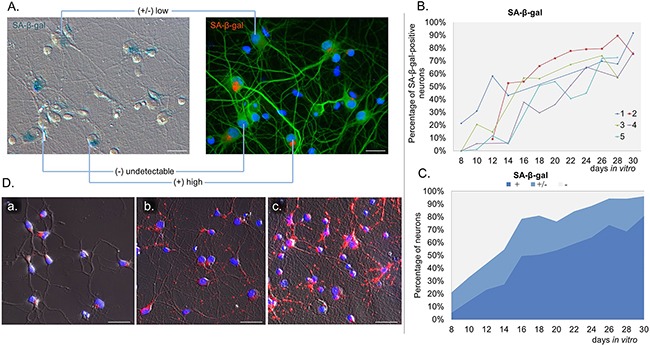
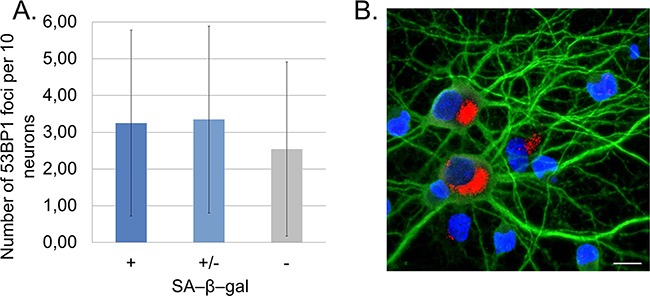
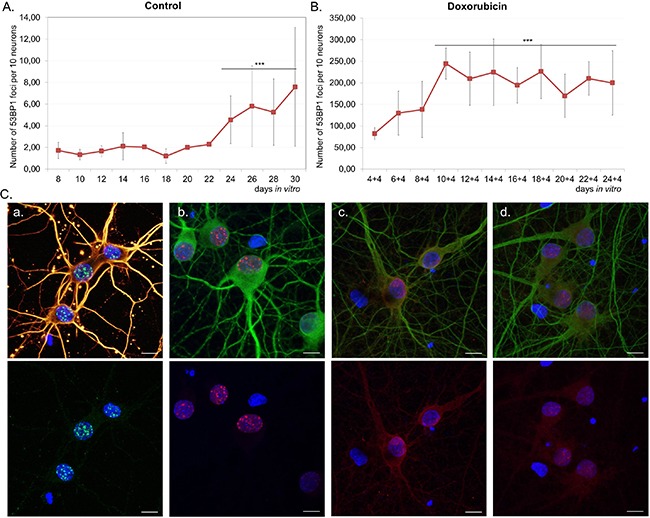
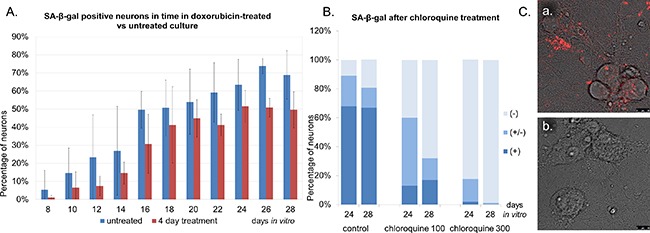
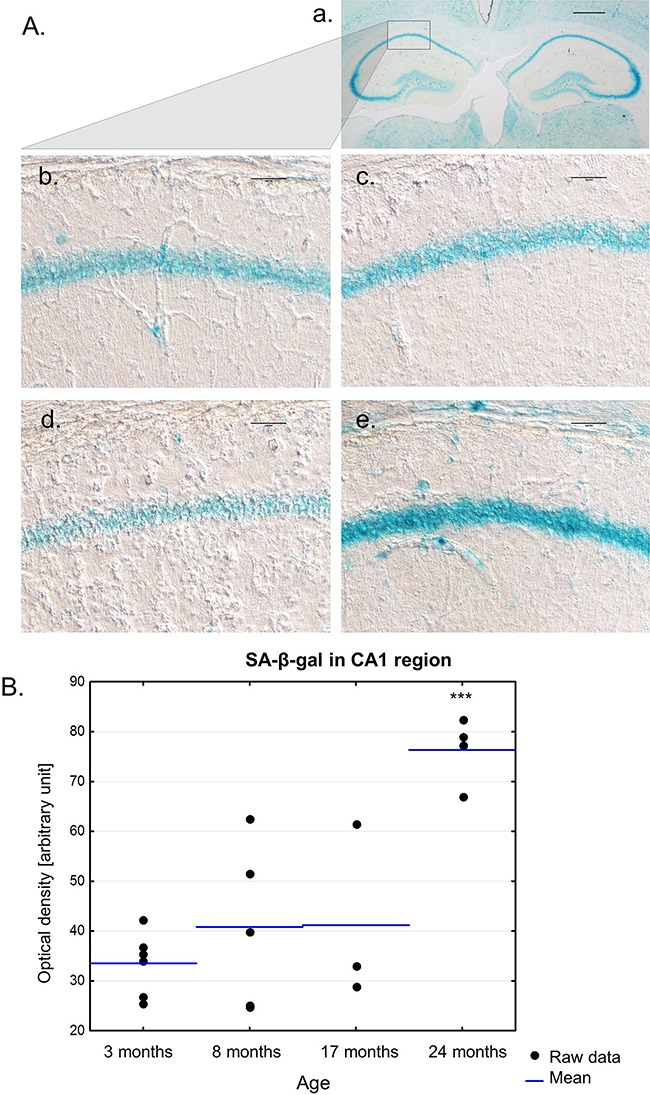
One of the features of cellular senescence is the activity of senescence-associated- β-galactosidase (SA-β-gal). The main purpose of this study was to evaluate this marker of senescence in aging neurons. We found that cortical neurons exhibited noticeable SA-β-gal activity quite early in culture. Many SA-β-gal-positive neurons were negative for another canonical marker of senescence, namely, double-strand DNA breaks (DSBs). Moreover, DDR signalling triggered by low doses of doxorubicin did not accelerate the appearance of neuronal SA-β-gal. In vivo, we observed pronounced induction of SA-β-gal activity in the hippocampus of 24-month-old mice, which is consistent with previous findings and supports the view that at this advanced age neurons developed a senescence-like phenotype. Surprisingly however, relatively high SA-β-gal activity, probably unrelated to the senescence process, was also observed in much younger, 3-month-old mice. In conclusion, we propose that SA-β-gal activity in neurons cannot be attributed uniquely to cell senescence either in vitro or in vivo. Additionally, we showed induction of REST protein in aging neurons in long-term culture and we propose that REST could be a marker of neuronal senescence in vitro.

Keywords: DNA damage response; SA-β-galactosidase; aging; neurons; senescence.


Conflict of interest statement

CONFLICTS OF INTEREST

No competing interests declared.

Figures

Figure 1
Figure 1. Nuclear level of REST increases in aged neurons in parallel to IL-6 expression
A. Confocal immunofluorescence labelling for REST (red), the neuronal marker MAP2 (green) and DNA (Hoechst, blue) in cortical neurons at 15 (a) 22 (b) and 30 DIV (days in vitro) (c). Scale bars represent 25 μm. B. Measurement of fluorescence intensity of nuclear REST in neurons. Data were obtained from three independent cultures. The majority of neurons stained positively for REST. C. Measurement of IL-6 mRNA expression in neuronal cultures over time.
Figure 2
Figure 2. Gradual SA-β-gal induction in long-term neuronal cultures
A. The image of neuronal staining (MAP2, green, right) merged with transmitted light image (left) of SA-β-gal activity (red) showing variability in the intensity of the SA-β-gal signal in neurons. B. Quantification of the percentage of neurons with high SA-β-gal signal in five cultures over a period of time. For each culture about 60 neurons were analysed per one time point. C. Mean values of the percentage of neurons exhibiting SA-β-gal activity with time: (+): high, (+/-): low, (-): undetectable SA-β-gal. D. Representative fluorescent images of LysoTracker Red staining in neuronal cultures over time: 4 DIV (a), 11 DIV (b), 18 DIV (c) from two independent experiments. Scale bars represent 25μm.
Figure 3
Figure 3. SA-β-gal-positive neurons do not accumulate DSB foci marked by p53BP1 staining
A. Quantitative analysis of the number of p53BP1 foci in SA-β-gal-positive and negative neurons calculated from four cultures. At least 200 neurons were analysed in each group. Values represent the mean ± S.D. SA-β-gal (+): high, (+/-): low, (-): undetectable. B. A representative image of SA-β-gal-positive neurons (red) with no p53BP1 foci detected. A scale bar represents 10 μm.
Figure 4
Figure 4. The number of DSB foci and DDR activation in long-term- and doxorubicin-treated neuronal cultures
Neurons were cultivated untreated A. or treated with 10 nM doxorubicin for four days B. and stained for p53BP1. The average number of nuclear p53BP1 foci per ten neurons was calculated. For each culture at least 60 neurons were analysed at each time point. Values represent the mean ± S.D, ***P>0.001 by ANOVA from four independent experiments (control) and three independent experiments (doxorubicin); the mean value of 24-30 DIV relative to 8 DIV (for A), relative to 4+4 DIV (for B). C. DDR activation in 14 DIV neurons treated with doxorubicin. Images show staining for γH2AX (green), β-tubulin (yellow) (a), p53BP1(red), MAP2 (green) (b), P-ATM (Ser1981) (red), MAP2 (green) (c), P-CHK2 (Thr68) (red), MAP2 (green) (d). Scale bars represent 10 μm.
Figure 5
Figure 5. Doxorubicin-treated cultures do not have more SA-β-gal-positive neurons than untreated ones
A. Neurons were treated with 10 nM doxorubicin for four days or cultivated untreated and stained for SA-β-gal. Quantitative analysis of the mean number of neurons with high SA-β-gal signal in untreated- versus doxorubicin-treated neurons. Values represent the mean ± S.D. from at least three independent experiments. B. A dose-dependent decrease in the number of SA-β-gal-positive neurons after chloroquine treatment. SA-β-gal (+): high, (+/-): low, (-): undetectable. C. A representative image of LysoTracker Red- stained neurons: control (a) or treated with chloroquine (b). Scale bars represent 10 μm.
Figure 6
Figure 6. The presence of SA-β-gal activity in the hippocampus of mice of different ages
A. A low magnification image of hippocampi with a neighbouring area in the brain of the 3-month-old mouse. Scale bar represents 500 μm (a). Representative images of SA-β-gal staining in the hippocampus of 3-month- (b), 8-month- (c), 17-month- (d), 24-month-old mice (e). Scale bars represent 100μm. B. Quantification of SA-β-gal staining in the hippocampus of mice of different ages. Single replicates are shown with blue lines representing the mean value, ***P>0.001 relative to all remaining groups (ANOVA).

Similar articles

Cited by

References

    1. Sikora E, Arendt T, Bennett M, Narita M. Impact of cellular senescence signature on ageing research. Ageing Res Rev. 2011;10:146–152. - PubMed
    1. Jeyapalan JC, Ferreira M, Sedivy JM, Herbig U. Accumulation of senescent cells in mitotic tissue of aging primates. Mech Ageing Dev. 2007;128:36–44. - PMC - PubMed
    1. Bhat R, Crowe EP, Bitto A, Moh M, Katsetos CD, Garcia FU, Johnson FB, Trojanowski JQ, Sell C, Torres C. Astrocyte senescence as a component of Alzheimer's disease. PLoS One. 2012;7:e45069. - PMC - PubMed
    1. Campisi J. Senescent Cells, Tumor Suppression, and Organismal Aging: Good Citizens, Bad Neighbors. Cell. 2005;120:513–522. - PubMed
    1. Jurk D, Wang C, Miwa S, Maddick M, Korolchuk V, Tsolou A, Gonos ES, Thrasivoulou C, Saffrey MJ, Cameron K, von Zglinicki T. Postmitotic neurons develop a p21-dependent senescence-like phenotype driven by a DNA damage response. Aging Cell. 2012;11:996–1004. - PMC - PubMed

Publication types

MeSH terms