. 2016 Oct 21;11(10):e0165254.
doi: 10.1371/journal.pone.0165254. eCollection 2016.

Evaporimeter and Bubble-Imaging Measures of Sweat Gland Secretion Rates

Affiliations

Evaporimeter and Bubble-Imaging Measures of Sweat Gland Secretion Rates

Jeeyeon Kim et al. PLoS One. .

Abstract

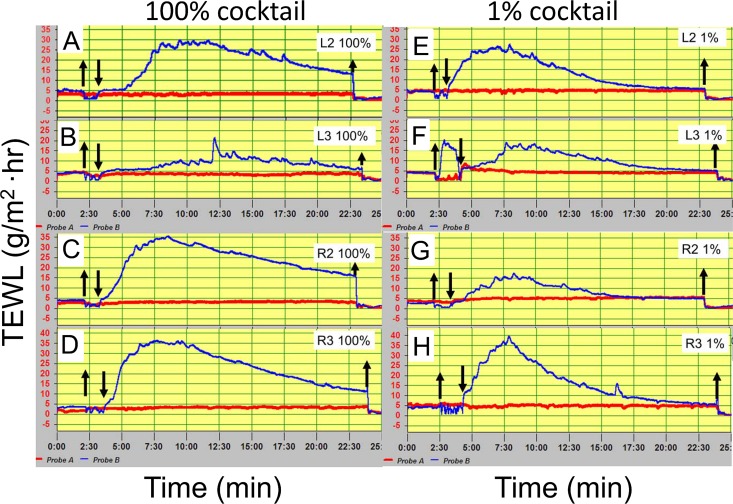
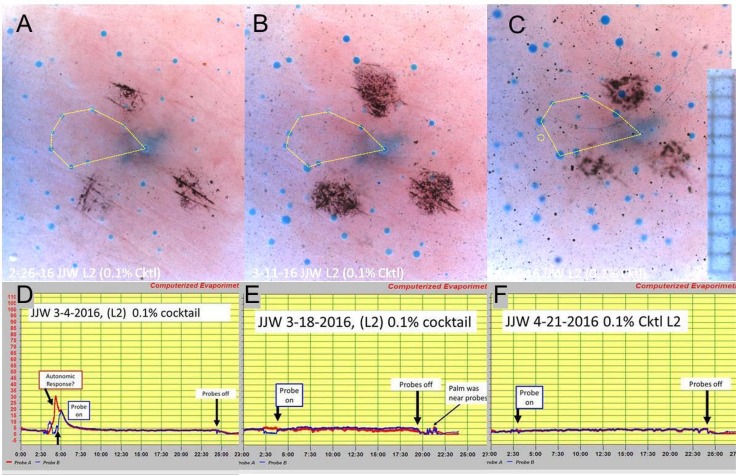
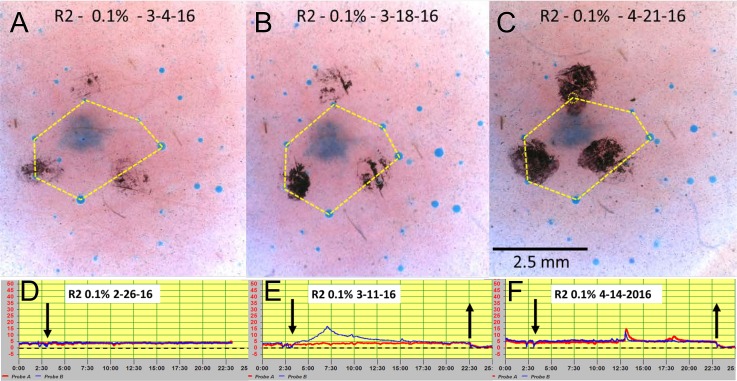
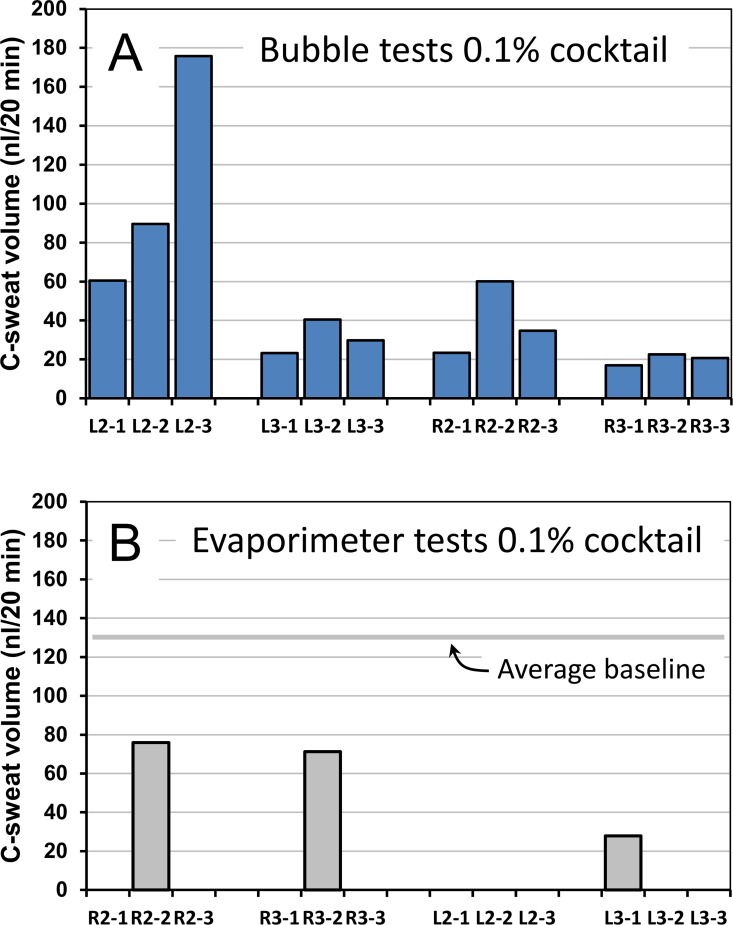
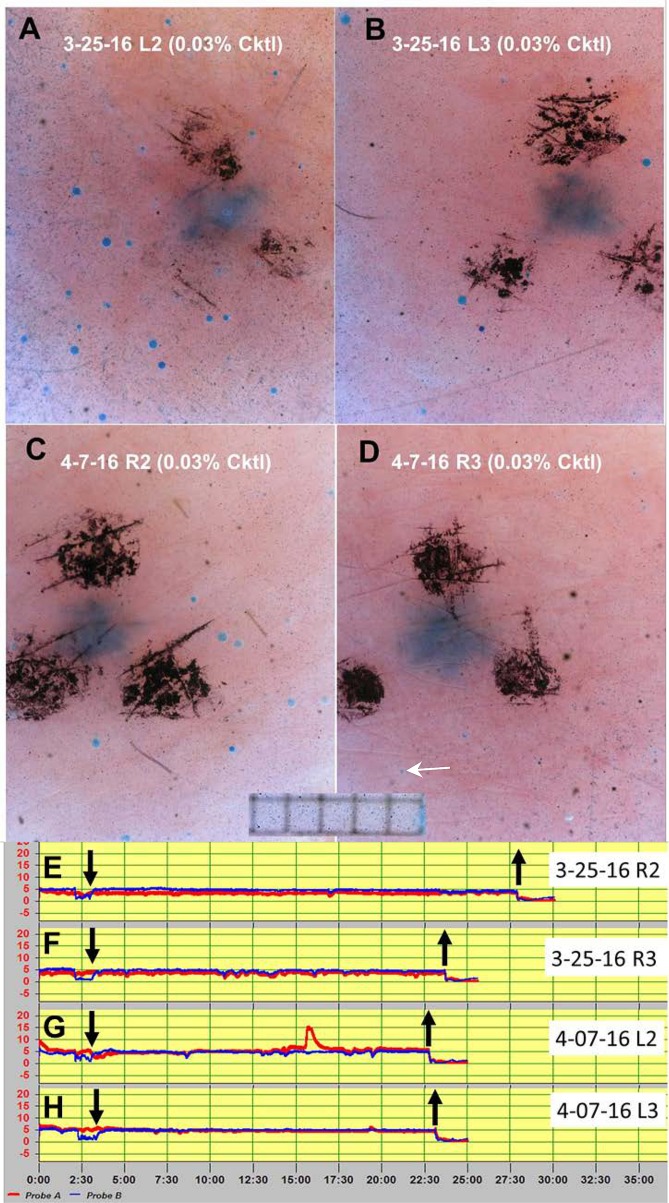
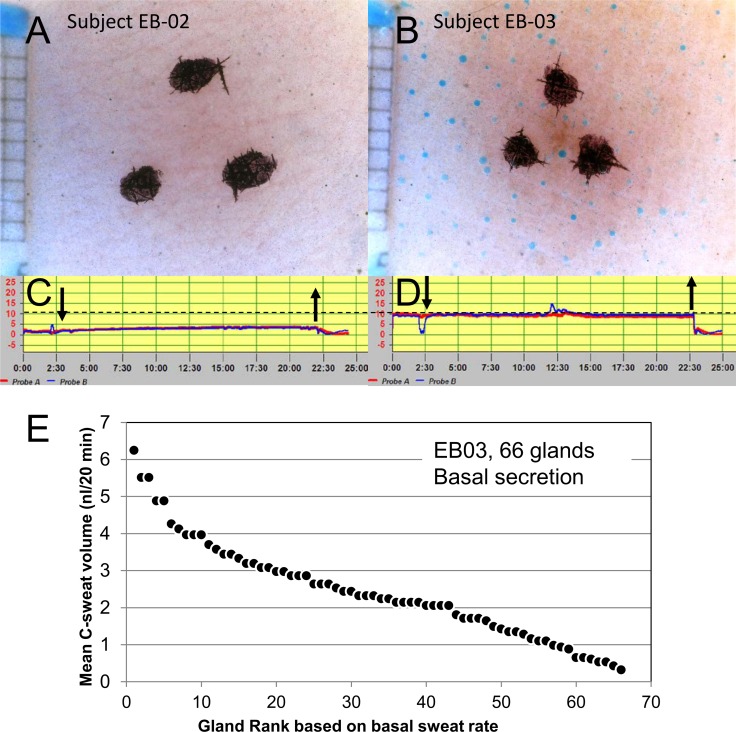
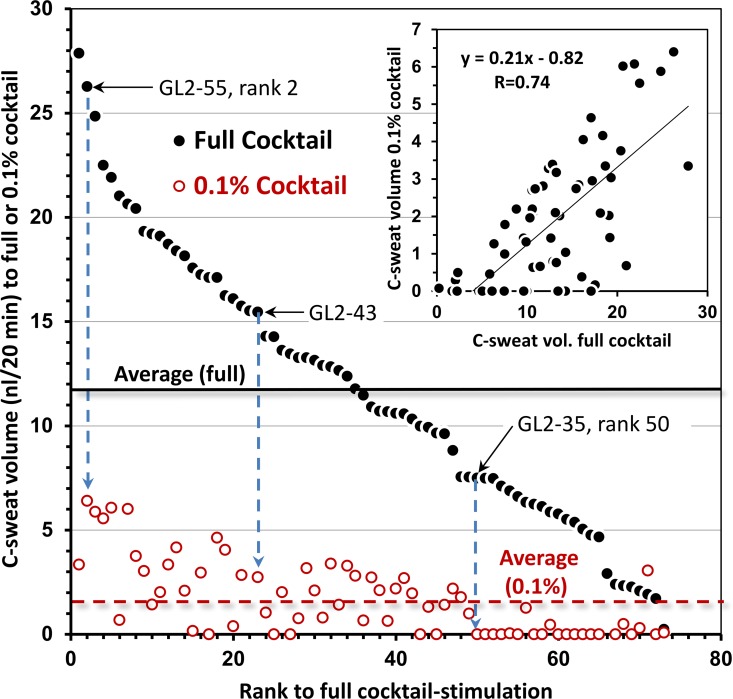
Beta-adrenergically-stimulated sweat rates determined by evaporimetry or by sweat bubble imaging are useful for measuring CFTR function because they provide a near-linear readout across almost the full range of CFTR function. They differentiate cystic fibrosis (CF) subjects from CF carriers and carriers from controls. However, evaporimetry, unlike bubble imaging, appears to be unable to detect improved levels of CFTR function in G551D subjects taking the CFTR modulator ivacaftor. Here, we quantify the sensitivity of evaporimetry and bubble imaging methods for assessing low levels of CFTR-dependent sweat rates. To establish sensitivity, we did dose-ranging studies using intradermally injected [cAMP]i-elevating cocktails. We reduced isoproterenol/aminophylline levels while maintaining a high level of atropine to block muscarinic elevation of [Ca2+]i. We stimulated the same sets of glands for both assays and recorded responses for 20 min. In response to a 3-log dilution of the stimulating cocktail (0.1%), bubble responses were detected in 12/12 tests (100%), with 49% ± 3% of glands secreting to produce an aggregate volume of 598 nl across the 12, 20-min tests. This was ~5% of the response to full cocktail. Evaporimetry detected responses in 3/12 (25%) tests with an aggregate secretion volume of 175 nl. After stimulation with a still more dilute cocktail (0.03%), bubble imaging detected 15 ± 13% of glands secreting at a rate ~0.9% of the response to full cocktail, while zero responding was seen with evaporimetry. The bubble imaging method detected secretion down to aggregate rates of <0.2 nl/(cm2·min), or ~1/30th of the average basal transepithelial water loss (TEWL) in the test subject of 4 g/m2·hr or 6.7 nl/(cm2·min). The increased sensitivity of bubble imaging may be required to detect small but physiologically important increases in secretion rates produced by CFTR modulators.


Conflict of interest statement

The authors have declared that no competing interests exist.

Figures

Fig 1
Fig 1. Sweat bubble imaging and evaporimetry.
Here the left arm is being tested using sweat bubble imaging and the right with evaporimetry. The reservoir slides into the holder which is held in fixed position to the frame; the camera can be precisely positioned using micrometer drives. Two probes are used for evaporimetry: one stays on the same patch of skin throughout and serves as a control; the other is removed to allow for injections and then replaced. Two tattooed sites on each arm were used to ensure that the same populations of identified glands were sampled by each assay.
Fig 2
Fig 2. C-sweat responses of the heterozygote (EB01) to intradermal injections of 100% and 1% strength cocktail measured at 4 sites with evaporimetry.
(A)-(D) show evaporimetry traces to the 100% cocktail strength at each of the 4 sites; (E)-(H) show traces to 1% cocktail. Down arrows show probes on and up arrows show probes off. Evaporimeter traces show TEWL units of 5 g/(m2·hr) (y-axis) and units of 2.5 min (x-axis).
Fig 3
Fig 3. C-sweat responses at site L2 to injection of 0.1% strength cocktail measured with the bubble method and with evaporimetry.
Each panel A-C shows bubble responses. (A). For this and following images, the fuzzy dark spot in the center is a tattoo to mark the spot, and the 3 surrounding dark spots are ink marks to aid focus and orientation. Eight glands are connected by the yellow dotted line to illustrate how constellations of identified glands can be followed across tests. (B) Same site as A, two weeks later. (C) Same site as A, 4 weeks later. This was the largest sweat bubble response seen out of 12 tests. Here, G93 in the marked constellation did not secrete (dotted circle) even though overall secretion was higher on this test. Grid squares on 0.5 mm. D-F show evaporimetry responses at the same site, tested one week later in each case. Probe A (red traces) are the control (not-injected site) and probe B (blue traces) are the injected site. (D). Large transient responses occurred at both sites at the time of the injection. The subject expressed alarm because the injection needle appeared close to a vein. (E, F): As for D, but 2 and 6 weeks later.
Fig 4
Fig 4. C-sweat responses at site R2 to injection of 0.1% strength cocktail measured with the bubble method and with evaporimetry.
This site was chosen because it showed the largest evaporimetry response seen to 0.1% cocktail. (A-C) show bubble responses, the same 6 glands were connected by thin yellow lines in each image except for (C), where no bubble was visible at the apex of the hexagram (dotted circle). (D-F) show evaporimetry responses at the same site offset by one week. All other descriptors are as for Fig 2. The largest evaporimetry response to 0.1% cocktail is shown in (E). Excursions in (F) are artifacts of unknown cause. Down arrow: probe B on; up arrow: probes off.
Fig 5
Fig 5. Summary of responses to 0.1% cocktail in a CF carrier measured in triplicate at 4 sites with sweat bubble imaging and evaporimetry.
(A) Total volume of sweat imaged after 20 min stimulation at each site (blue columns). (B) Total volume of sweat estimated from evaporimetry measurement of TEWL (see text). The average TEWL baseline for this subject across all 12 tests is shown; this value was subtracted from the transient sweat responses (gray columns).
Fig 6
Fig 6. Responses to 0.03% cocktail in a CF carrier measured once at the same 4 sites with sweat bubble imaging and evaporimetry.
(A-D) show sweat bubbles after 20 min of stimulation with 0.03% cocktail strength at each of the 4 sites (cropped images). (E-H) show evaporimetry traces to the 0.03% cocktail strength at each of the 4 sites. Down arrows show probes on and up arrows show probes off. Grid squares in (A-D) are 0.5 mm. Evaporimeter traces (E-H) show TEWL in units of 5 g/(m2·hr) on y-axis and units of 2.5 min on x-axis.
Fig 7
Fig 7. Bubble imaging and TEWL measures with evaporimetry in two subjects (EB-02, 03) who were not stimulated.
(A-B) show sweat bubble imaging after 20 min with no applied stimulus (and with no atropine to block any baseline cholinergic secretion). (C-D) show evaporimetry traces at the same sites. The dashed line shows a stable and consistent difference between the two subjects of ~6 g/(m2·hr) or 10 nl/(cm2·min). The summed bubble secretion corrected for the 0.6 cm2 size of the imaged area was 13.4 nl/cm2 ·min. This agreement is at least as good as the agreement for bubble tests at same sites on different days shown in Fig 5. However, in subsequent tests with this subject no bubbles were observed in spite of the same TEWL (see text). (E) Distribution of single gland basal secretion rates for sweat bubbles (n = 66) shown in panel (B). Each point plots the volume (y-axis) and rank for an individual gland.
Fig 8
Fig 8. Distribution of responses to two cocktail strength for 73 identified glands at site L2 of subject EB01.
Glands are rank ordered by the volume of their C-sweat in response to full cocktail (filled circles), and the corresponding response of each glands to the 0.1% b-adrenergic cocktail is shown directly below (open circles). Each pair of points represents the mean total volumes secreted during 20 min across 1–3 trials at the two cocktail strengths. (Three selected pairs of responses are connected by vertical arrows and are labeled by gland ID and rank based on response to full cocktail.) The solid horizontal line is the mean response to full cocktail and the dashed horizontal line is the mean response to 0.1% cocktail. The average coefficient of variation for individual gland responses was 0.36 to the full cocktail and 0.90 for 50 of 73 glands that responded to the 0.1% cocktail on at least one trial. Inset plots correlation of the two responses; R = .74, P <0.001.

References

    1. Riordan JR, Rommens JM, Kerem B, Alon N, Rozmahel R, Grzelczak Z, et al. Identification of the cystic fibrosis gene: cloning and characterization of complementary DNA. Science. 1989;245(4922):1066–73. . - PubMed
    1. Quinton PM. Cystic fibrosis: lessons from the sweat gland. Physiology. 2007;22:212–25. Epub 2007/06/15. 10.1152/physiol.00041.2006 . - DOI - PubMed
    1. Di Sant'Agnese P, Darling RC, Perara GA, Shea E. Abnormal electrolyte composition of sweat in cystic fibrosis of the pancreas. AMA Am J Dis Child. 1953;86(5):618–9; discussion, 9. Epub 1953/11/01. . - PubMed
    1. Accurso FJ, Van Goor F, Zha J, Stone AJ, Dong Q, Ordonez CL, et al. Sweat chloride as a biomarker of CFTR activity: proof of concept and ivacaftor clinical trial data. J Cyst Fibros. 2014;13(2):139–47. . - PMC - PubMed
    1. Collaco JM, Blackman SM, Raraigh KS, Corvol H, Rommens JM, Pace RG, et al. Sources of Variation in Sweat Chloride Measurements in Cystic Fibrosis. American journal of respiratory and critical care medicine. 2016. 10.1164/rccm.201603-0459OC . - DOI - PMC - PubMed