

Probing the Heterogeneity of Protein Kinase Activation in Cells by Super-resolution Microscopy
- PMID: 27768850
- PMCID: PMC5269639
- DOI: 10.1021/acsnano.6b05356
Probing the Heterogeneity of Protein Kinase Activation in Cells by Super-resolution Microscopy
Abstract
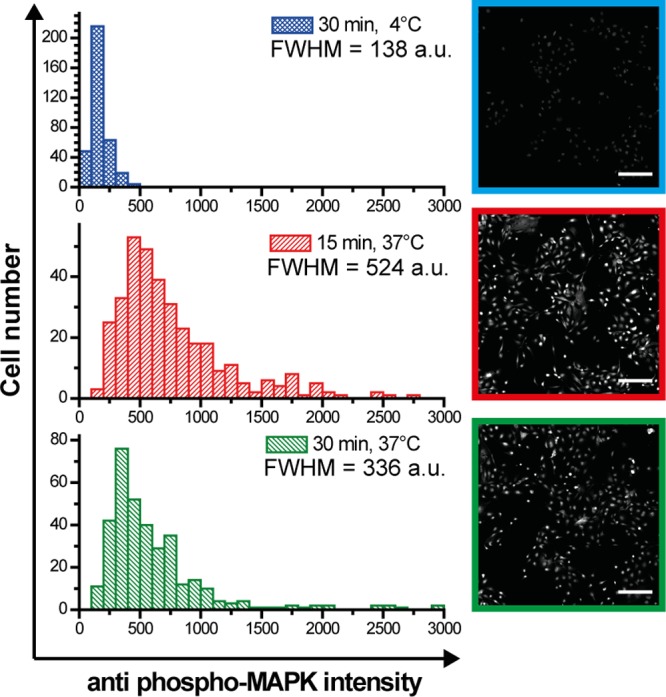
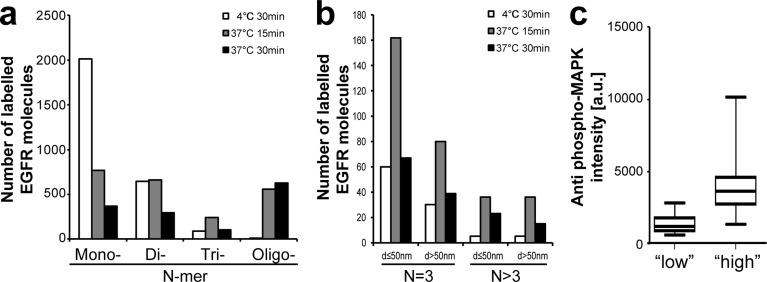
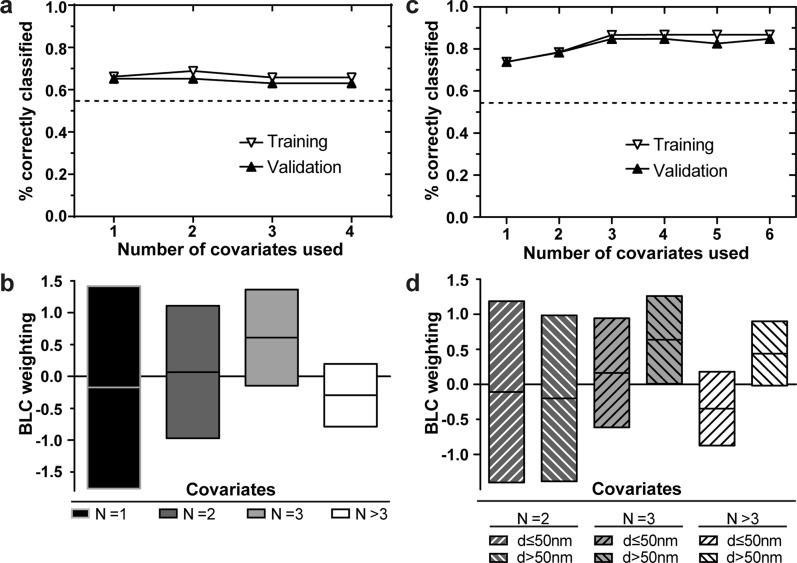
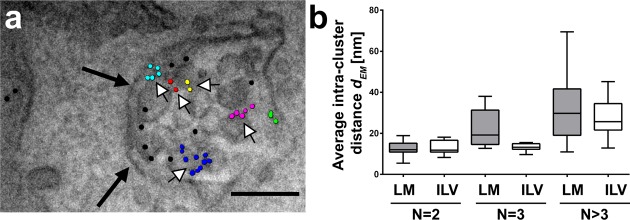
Heterogeneity of mitogen-activated protein kinase (MAPK) activation in genetically identical cells, which occurs in response to epidermal growth factor receptor (EGFR) signaling, remains poorly understood. MAPK cascades integrate signals emanating from different EGFR spatial locations, including the plasma membrane and endocytic compartment. We previously hypothesized that in EGF-stimulated cells the MAPK phosphorylation (pMAPK) level and activity are largely determined by the spatial organization of the EGFR clusters within the cell. For experimental testing of this hypothesis, we used super-resolution microscopy to define EGFR clusters by receptor numbers (N) and average intracluster distances (d). From these data, we predicted the extent of pMAPK with 85% accuracy on a cell-to-cell basis with control data returning 54% accuracy (P < 0.001). For comparison, the prediction accuracy was only 61% (P = 0.382) when the diffraction-limited averaged fluorescence intensity/cluster was used. Large clusters (N ≥ 3) with d > 50 nm were most predictive for pMAPK level in cells. Electron microscopy revealed that these large clusters were primarily localized to the limiting membrane of multivesicular bodies (MVB). Many tighter packed dimers/multimers (d < 50 nm) were found on intraluminal vesicles within MVBs, where they were unlikely to activate MAPK because of the physical separation. Our results suggest that cell-to-cell differences in N and d contain crucial information to predict EGFR-activated cellular pMAPK levels and explain pMAPK heterogeneity in isogenic cells.
Keywords: Bayesian modeling; EGFR; MAPK; cell-to-cell heterogeneity; super-resolution microscopy.
Conflict of interest statement
The authors declare no competing financial interest.
Figures
Similar articles
-
Estrogen signaling via a linear pathway involving insulin-like growth factor I receptor, matrix metalloproteinases, and epidermal growth factor receptor to activate mitogen-activated protein kinase in MCF-7 breast cancer cells.Endocrinology. 2007 Aug;148(8):4091-101. doi: 10.1210/en.2007-0240. Epub 2007 May 24. Endocrinology. 2007. PMID: 17525128 Free PMC article.
-
Protein-tyrosine-phosphatase-mediated epidermal growth factor (EGF) receptor transinactivation and EGF receptor-independent stimulation of mitogen-activated protein kinase by bradykinin in A431 cells.Biochem J. 2000 Apr 15;347(Pt 2):441-7. doi: 10.1042/0264-6021:3470441. Biochem J. 2000. PMID: 10749673 Free PMC article.
-
Growth hormone-induced phosphorylation of epidermal growth factor (EGF) receptor in 3T3-F442A cells. Modulation of EGF-induced trafficking and signaling.J Biol Chem. 2003 May 23;278(21):18902-13. doi: 10.1074/jbc.M300939200. Epub 2003 Mar 14. J Biol Chem. 2003. PMID: 12642595
-
Disruption of the annexin A1/S100A11 complex increases the migration and clonogenic growth by dysregulating epithelial growth factor (EGF) signaling.Biochim Biophys Acta. 2013 Jul;1833(7):1700-11. doi: 10.1016/j.bbamcr.2012.12.006. Epub 2012 Dec 14. Biochim Biophys Acta. 2013. PMID: 23246849
-
Down-regulation of epidermal growth factor receptor signalling within multivesicular bodies.Biochem Soc Trans. 2009 Feb;37(Pt 1):173-7. doi: 10.1042/BST0370173. Biochem Soc Trans. 2009. PMID: 19143625 Review.
Cited by
-
Alternative Splicing in Lung Adenocarcinoma: From Bench to Bedside.Cancers (Basel). 2025 Apr 15;17(8):1329. doi: 10.3390/cancers17081329. Cancers (Basel). 2025. PMID: 40282505 Free PMC article. Review.
-
Radionuclide-fluorescence Reporter Gene Imaging to Track Tumor Progression in Rodent Tumor Models.J Vis Exp. 2018 Mar 13;(133):57088. doi: 10.3791/57088. J Vis Exp. 2018. PMID: 29608157 Free PMC article.
-
It Takes More than Two to Tango: Complex, Hierarchal, and Membrane-Modulated Interactions in the Regulation of Receptor Tyrosine Kinases.Cancers (Basel). 2022 Feb 14;14(4):944. doi: 10.3390/cancers14040944. Cancers (Basel). 2022. PMID: 35205690 Free PMC article. Review.
-
Cooperation and Interplay between EGFR Signalling and Extracellular Vesicle Biogenesis in Cancer.Cells. 2020 Dec 8;9(12):2639. doi: 10.3390/cells9122639. Cells. 2020. PMID: 33302515 Free PMC article. Review.
-
Inhibitor-induced HER2-HER3 heterodimerisation promotes proliferation through a novel dimer interface.Elife. 2018 May 1;7:e32271. doi: 10.7554/eLife.32271. Elife. 2018. PMID: 29712619 Free PMC article.
References
-
- Gerlinger M.; Rowan A. J.; Horswell S.; Larkin J.; Endesfelder D.; Gronroos E.; Martinez P.; Matthews N.; Stewart A.; Tarpey P.; Varela I.; Phillimore B.; Begum S.; McDonald N. Q.; Butler A.; Jones D.; Raine K.; Latimer C.; Santos C. R.; Nohadani M.; et al. Intratumor Heterogeneity and Branched Evolution Revealed by Multiregion Sequencing. N. Engl. J. Med. 2012, 366, 883–892. 10.1056/NEJMoa1113205. - DOI - PMC - PubMed
Publication types
MeSH terms
Substances
Grants and funding
LinkOut - more resources
Full Text Sources
Other Literature Sources
Research Materials
Miscellaneous
