. 2016 Oct 20;167(3):670-683.e10.
doi: 10.1016/j.cell.2016.09.023.

Rickettsia Sca4 Reduces Vinculin-Mediated Intercellular Tension to Promote Spread

Affiliations

Rickettsia Sca4 Reduces Vinculin-Mediated Intercellular Tension to Promote Spread

Rebecca L Lamason et al. Cell. .

Abstract

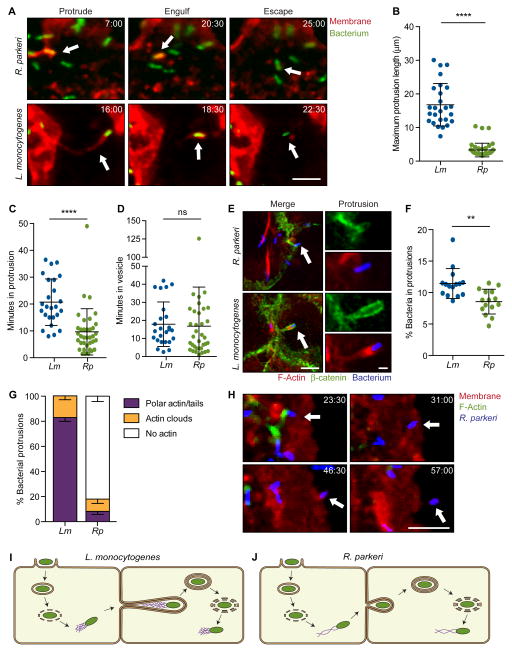
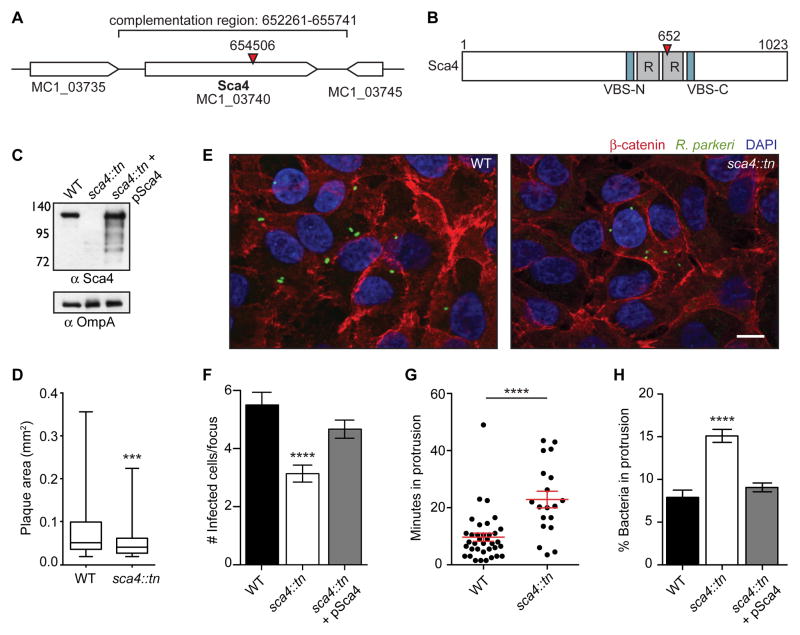
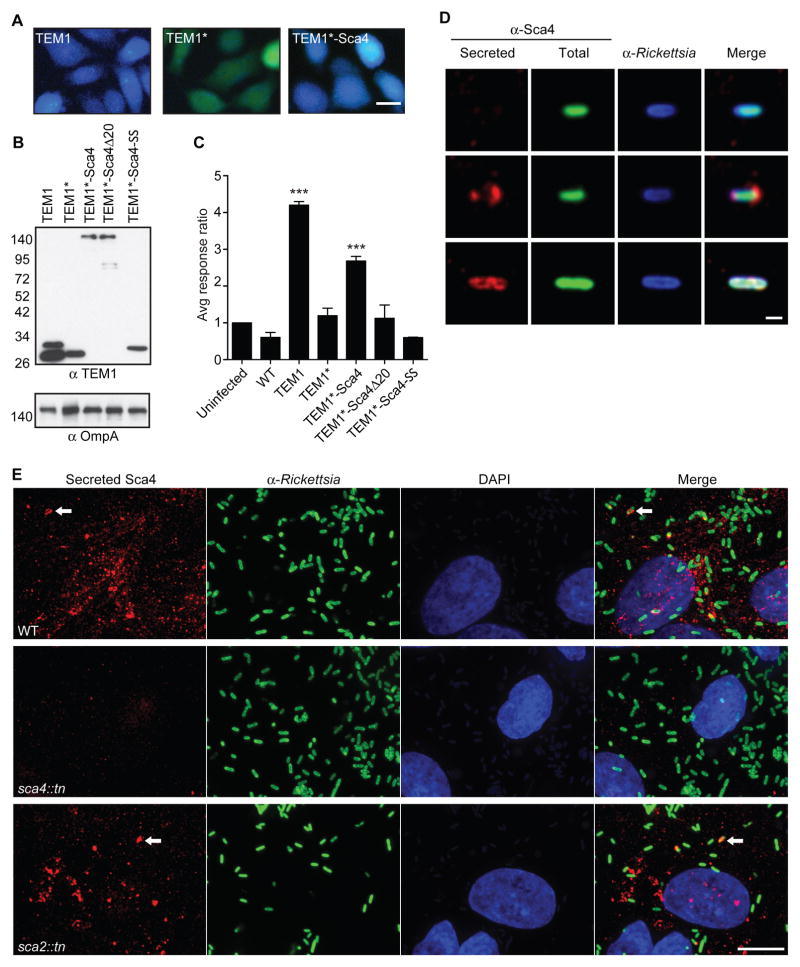
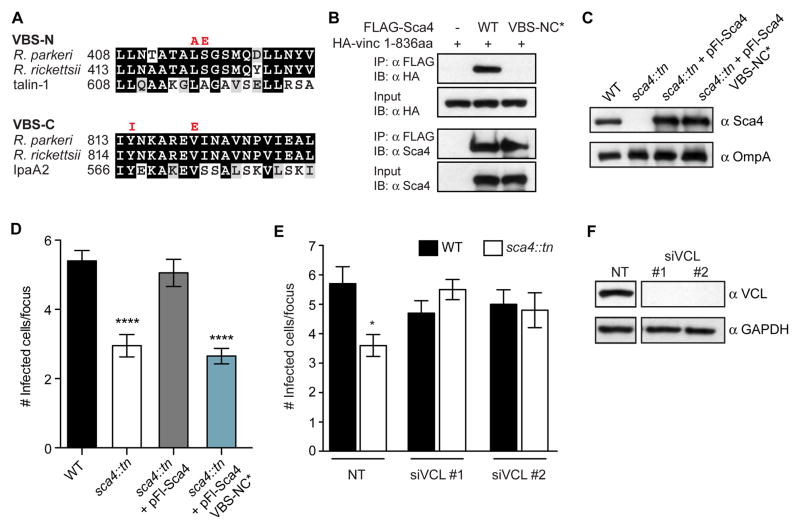
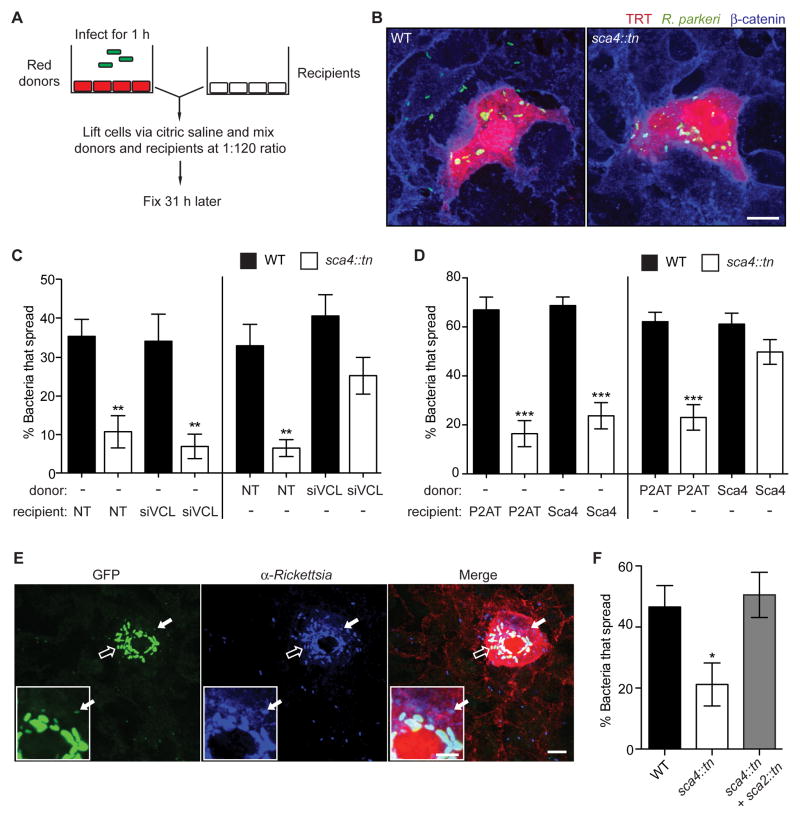
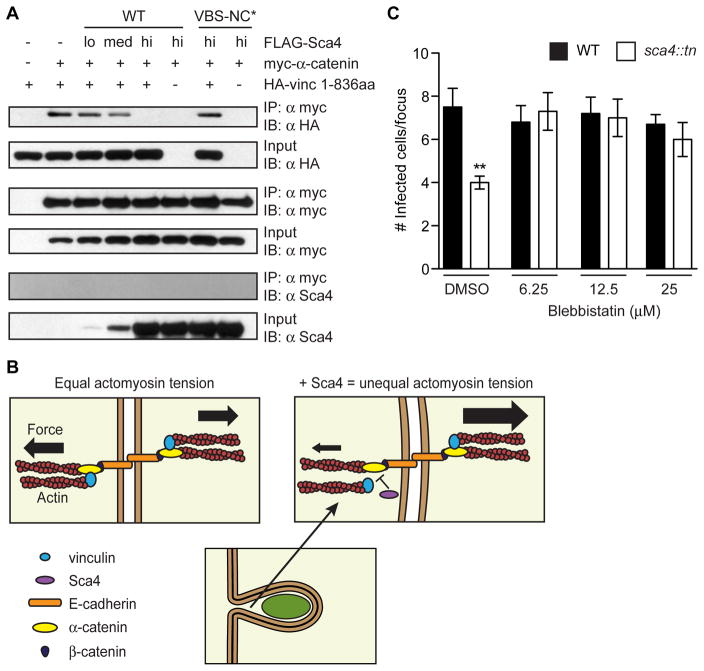
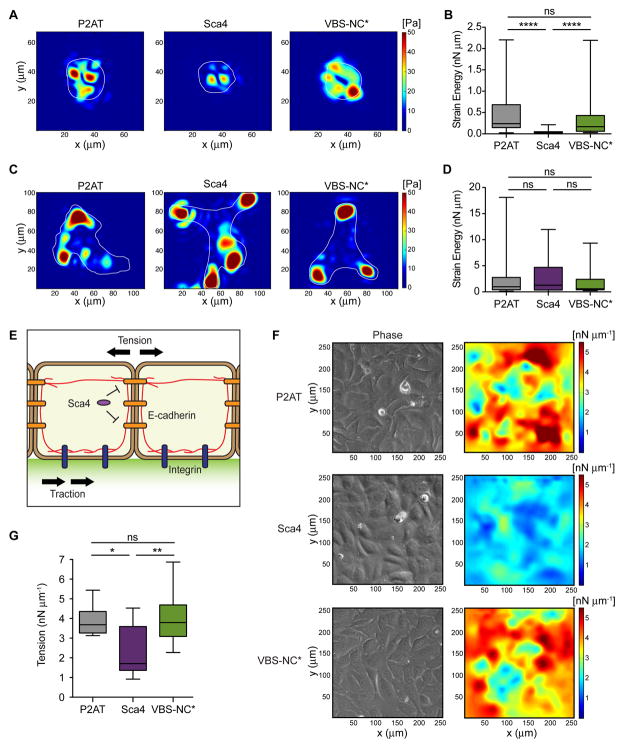
Spotted fever group (SFG) rickettsiae are human pathogens that infect cells in the vasculature. They disseminate through host tissues by a process of cell-to-cell spread that involves protrusion formation, engulfment, and vacuolar escape. Other bacterial pathogens rely on actin-based motility to provide a physical force for spread. Here, we show that SFG species Rickettsia parkeri typically lack actin tails during spread and instead manipulate host intercellular tension and mechanotransduction to promote spread. Using transposon mutagenesis, we identified surface cell antigen 4 (Sca4) as a secreted effector of spread that specifically promotes protrusion engulfment. Sca4 interacts with the cell-adhesion protein vinculin and blocks association with vinculin's binding partner, α-catenin. Using traction and monolayer stress microscopy, we show that Sca4 reduces vinculin-dependent mechanotransduction at cell-cell junctions. Our results suggest that Sca4 relieves intercellular tension to promote protrusion engulfment, which represents a distinctive strategy for manipulating cytoskeletal force generation to enable spread.

Keywords: actin-based motility; cell-to-cell spread; cytoskeleton; host-pathogen interactions; intercellular tension; listeria monocytogenes; mechanotransduction; rickettsia parkeri; sca4; vinculin.


Figures

Figure 1
Figure 1. R. parkeri exhibit a morphologically distinct method of cell-to-cell spread
(A) Live cell imaging snapshots of the three steps of spread for R. parkeri or L. monocytogenes (Red, TRTF; green, bacterium). (B–D) Quantification of spread parameters from live cell imaging showing (B) maximum protrusion length, (C) time spent in protrusion before engulfment and (D) time spent in vesicle before escape to cytosol. (E) Images of cells infected with Rp-2xTagBFP or Lm-TagBFP. Host membrane stained with anti-β-catenin (green) and F-actin stained with phalloidin (red). Arrow indicates protrusions shown at right. Scale bar for merge image, 5 μm; protrusion image, 1 μm. (F) Percentage of bacteria in protrusions. (G) Percentage of bacterial protrusions with different F-actin phenotypes. Mean ± SEM. (H) Live cell imaging snapshots of Rp-2xTagBFP spread. Arrow indicates a bacterium spreading into unlabeled recipient cell. (Red, TRTF; green, Lifeact-mWasabi; blue, bacterium). (I, J) Infectious life cycles of (I) L. monocytogenes and (J) R. parkeri illustrating differences in the presence or absence of actin tails in protrusions and the organization of actin filaments in tails (actin tail, purple; bacterium, green). For (A) and (H), time shown as min:sec and scale bar, 5 μm. Data from (B–D) and (F) are mean ± SD, unpaired T-test: ** p < 0.01, *** p < 0.001. Rp, R. parkeri; Lm, L. monocytogenes. See Movies S1–S3.
Figure 2
Figure 2. Transposon mutagenesis of R. parkeri sca4 leads to a defect in cell-to-cell spread
(A) R. parkeri chromosome region containing the sca4 gene (red arrowhead, tn insertion; bracket, region used for complementation). (B) Sca4 protein schematic indicating the VBSs, predicted antigenic repeats (R) and tn insertion at residue 652 (red arrowhead). (C) Western blot of purified R. parkeri strains, WT (Rp-GFP), sca4::tn and sca4::tn + pSca4 (pRAM18dSGA-Sca4). (OmpA, loading control) (D) Plaque areas in cell monolayers infected with WT and sca4::tn R. parkeri. (E) Images of infectious foci formed by WT (Rp-GFP) and sca4::tn strains. (Red, β-catenin; green, R. parkeri; blue, DAPI). Scale bar, 10 μm. (F) Infectious focus sizes formed by WT (Rp-GFP), sca4::tn and sca4::tn + pSca4 strains. (G) Average time each bacterium spent in a protrusion before resolution into a vesicle (WT data are from Figure 1C). (H) Percentage of bacteria within a protrusion. Data for (D) and (F–H) are mean ± SEM, unpaired T-test: *** p < 0.001 **** p < 0.0001 relative to WT. See Figure S1.
Figure 3
Figure 3. Sca4 is secreted from R. parkeri
(A) Merged images of cells infected with R. parkeri expressing TEM1, TEM1* and TEM1*-Sca4 and treated with CCF4/AM. (Blue, cleaved CCF4/AM; green, uncleaved CCF4/AM). Scale bar, 20 μm. (B) Western blot of TEM1 fusions expressed in purified R. parkeri strains. Lane 1, two TEM1 bands represent uncleaved and processed species. (C) TEM1 assay response ratio (blue:green). Data are mean ± SD, one-way ANOVA: *** p < 0.001 relative to uninfected, which is set to 1. (D) Images of individual bacteria after infection of A549 cells, showing non-secreted (top row) or secreted Sca4 (bottom 2 rows). Scale bar, 1 μm. (E) Images of secreted Sca4 in cells infected with WT, sca4::tn or sca2::tn. Maximum intensity projections shown. Scale bar, 10 μm. Arrows indicate Sca4 that is localized near a bacterium.
Figure 4
Figure 4. Sca4 targets vinculin to promote spread
(A) Sequence alignments of the indicated VBSs (black, identical residues; grey, similar residues). VBS-NC* mutant amino acid substitutions are indicated in red. (B) Co-IP between FLAG-tagged Sca4 (WT and VBS-NC*) and the 1–836aa truncation of vinculin. IP, immunoprecipitate; IB, immunoblot. (C) Western blot showing expression levels of Sca4 in indicated purified R. parkeri strains. (D) Infectious focus size formed by WT (Rp-GFP), sca4::tn, sca4::tn + pFl-Sca4 (pRAM18dSGA-Sca4pr-Flag-Sca4) and sca4::tn + pFl-Sca4 VBS-NC* strains. Mean ± SEM, unpaired T-test: **** p < 0.0001 relative to WT. (E) Infectious focus size after reverse transfection with control siRNA (nontarget, NT) or vinculin-specific siRNAs (siVCL #1, #2) and infection with WT (Rp-GFP) or sca4::tn. Mean ± SEM, unpaired T-test: **** p < 0.0001 relative to WT + NT. (F) Western blot of A549 lysates from (E) (GAPDH, loading control). Space in blots indicates deletion of irrelevant lane.
Figure 5
Figure 5. Sca4 acts in trans to target vinculin in the donor cell
(A) Mixed cell assay schematic, as described in methods. (B) Images of infectious foci detected in the mixed cell assay showing A549-TRT (soluble TagRFP-T, red), R. parkeri (green) and β-catenin (blue). Scale bar, 10 μm. (C) Mixed cell assay results showing percentage of bacteria that spread to recipient cells in a focus. Donor or recipient cells were reverse transfected with control siRNA (NT) or siVCL #1 and infected with WT (Rp-GFP) or sca4::tn. Mean ± SEM, one-way ANOVA: ** p < 0.01 relative to WT + NT in each set. (D) Mixed cell assay results as in (C) except indicated donors or recipients were transduced with FCW2-P2AT (control) or FCW2-P2AT-Ires-Sca4 (Sca4). One-way ANOVA: *** p < 0.001 relative to WT + P2AT in each set. (E and F) Mixed cell assay as in (A, B) except the donor cell was infected with WT (Rp-GFP), sca4::tn or a mixture of sca4::tn and sca2::tn. (E) Image of an infectious focus co-infected with sca2::tn (bright green, open arrow) and sca4::tn (dim green, solid arrow) and counterstained for Rickettsia (blue) and β-catenin (red). Scale bar, 10 μm. Inset, expanded view of donor cell region indicated by solid arrow (inset scale bar, 5 μm). (F) Percentage of bacteria that spread for WT (Rp-GFP), sca4::tn, or sca4::tn in the presence of sca2::tn. No spread was detected for sca2::tn. Mean ± SEM, one-way ANOVA: * p < 0.05 relative to WT. See Figure S2.
Figure 6
Figure 6. Sca4 disrupts donor cell adherens junction complexes to relieve tension and promote spread
(A) Competition co-IP assay between vinculin (HA-vinc 1-836aa), myc-α-catenin and FLAG-Sca4. (B) Model of Sca4 inhibition of vinculin function. In uninfected cells, vinculin and α-catenin promote junction stability via reciprocal actin-mediated pulling forces. Sca4 disrupts the vinculin:α-catenin interaction, thus reducing donor cell actomyosin tension and increasing membrane flexibility to improve spread efficiency. (C) Infectious focus size after 20 h blebbistatin (6.25 μm-25 μM) or DMSO (control) treatment. Mean ± SEM, unpaired T-test: ** p < 0.01 relative to WT + DMSO.
Figure 7
Figure 7. Sca4 modulates E-cadherin forces in a vinculin-dependent manner
TFM results for individual cells adherent to polyacrylamide gels coated with E-cadherin-Fc (A, B) or collagen I (C, D). (A, C) Instantaneous maps showing the magnitude of traction stresses (color indicates stress values in Pa). Cell outlines in white. (B, D) Time-averaged strain energy (nN μm) from individual cells. (E) Model depicting how biomechanical crosstalk allows measurements of traction stresses at cell-ECM junctions to be converted to tension. Cells adhere to a gel containing green fluorescent beads in upper layer. Actin cables (red) connect E-cadherin (orange) and integrin (blue) adhesions. Sca4 specifically targets cell-cell junctions. (F) MSM results for cell monolayers adherent to gels coated with collagen I. Images show the distribution of tension (right) and cells as seen by phase contrast (left). (G) Time-averaged monolayer tension (nN μm−1) calculated for multiple regions within the monolayer. Mann-Whitney rank sum T-test: * p < 0.05, ** p < 0.01, **** p < 0.0001. See Figure S2.

Comment in

References

    1. Alvarez DE, Agaisse H. The metallo-protease Mpl supports Listeria monocytogenes dissemination through resolution of membrane protrusions into vacuoles. Infection and Immunity. 2016;84:1806–1814. - PMC - PubMed
    1. Atherton P, Stutchbury B, Jethwa D, Ballestrem C. Mechanosensitive components of integrin adhesions: Role of vinculin. Exp Cell Res. 2016;343:21–27. - PMC - PubMed
    1. Banerjee I, Carrion K, Serrano R, Dyo J, Sasik R, Lund S, Willems E, Aceves S, Meili R, Mercola M, et al. Cyclic stretch of embryonic cardiomyocytes increases proliferation, growth, and expression while repressing Tgf-β signaling. J Mol Cell Cardiol. 2015;79:133–144. - PMC - PubMed
    1. Barry AK, Tabdili H, Muhamed I, Wu J, Shashikanth N, Gomez GA, Yap AS, Gottardi CJ, de Rooij J, Wang N, et al. α-catenin cytomechanics--role in cadherin-dependent adhesion and mechanotransduction. J Cell Sci. 2014;127:1779–1791. - PMC - PubMed
    1. Bastounis E, Meili R, Alonso-Latorre B, del Álamo JC, Lasheras JC, Firtel RA. The SCAR/WAVE complex is necessary for proper regulation of traction stresses during amoeboid motility. Mol Biol Cell. 2011;22:3995–4003. - PMC - PubMed

Publication types

MeSH terms