. 2016 Oct 20;167(3):709-721.e12.
doi: 10.1016/j.cell.2016.09.045.

Genomic Nucleosome Organization Reconstituted with Pure Proteins

Affiliations

Genomic Nucleosome Organization Reconstituted with Pure Proteins

Nils Krietenstein et al. Cell. .

Abstract

Chromatin remodelers regulate genes by organizing nucleosomes around promoters, but their individual contributions are obfuscated by the complex in vivo milieu of factor redundancy and indirect effects. Genome-wide reconstitution of promoter nucleosome organization with purified proteins resolves this problem and is therefore a critical goal. Here, we reconstitute four stages of nucleosome architecture using purified components: yeast genomic DNA, histones, sequence-specific Abf1/Reb1, and remodelers RSC, ISW2, INO80, and ISW1a. We identify direct, specific, and sufficient contributions that in vivo observations validate. First, RSC clears promoters by translating poly(dA:dT) into directional nucleosome removal. Second, partial redundancy is recapitulated where INO80 alone, or ISW2 at Abf1/Reb1sites, positions +1 nucleosomes. Third, INO80 and ISW2 each align downstream nucleosomal arrays. Fourth, ISW1a tightens the spacing to canonical repeat lengths. Such a minimal set of rules and proteins establishes core mechanisms by which promoter chromatin architecture arises through a blend of redundancy and specialization.

Keywords: Abf1; INO80; Isw; RSC; Reb1; Saccharomyces cerevisiae; chromatin; general regulatory factors (GRFs); in vitro reconstitution; nucleosome positioning and remodeling.


Figures

Figure 1
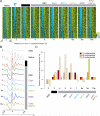
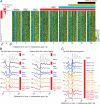
Figure 1. Purified remodelers reconstitute genome-wide NFR/+1/array nucleosomal organizations in remodeler-depleted extract
(A) Nucleosome dyad density along genes (4,118 rows) as detected by MNase-(anti-H3-ChIP)-seq were color-coded (yellow, black, and blue represent high, medium, and low tag density, respectively) and each gene aligned at in vivo-defined +1 nucleosome dyads. In all graphs, rows were sorted based on decreasing +1-to-NFR tag ratio in graph 2 (as indicated by the triangles). Throughout all figures, graph number/letter represents a dataset ID that is particular to each figure and its supplemental figure. The exact composition of each sample for all figures is given in Table S3. “Native” denotes chromatin isolated from cells, then crosslinked in vitro so as to provide a “gold” standard of what can be achieved in vitro. Graph 2 shows the starting pattern consisting solely of histones assembled onto genomic DNA plasmid libraries by salt gradient dialysis (SGD). Purified remodelers were added along with whole cell extract, as indicated. (B) Composite plots of data shown in panel (A), where the graphs were vertically separated but scaled identically. Grey dashed lines demarcate dyad peaks in the Native dataset. (C) Distances of the nucleosome +1, +2 and +3 peak positions relative to the respective Native positions for the traces in panel B. Transparent hatched bars show values that were not meaningful due to high nucleosome fuzziness. N/A, not applicable due to absence of peak. “0” denotes that the distance was zero. See also Figures S1 and S2, and Tables S1, S2 and S3.
Figure 2
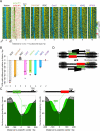
Figure 2. RSC creates physiological NFRs using strand-specific poly(dT)/(dA) tracts
(A) See Figure 1A description but no extract was added. Graph 2: distribution of poly(dT) and poly(dA) tracts ≥6 bp in green and red, respectively. See also Figure S3C. Data for Native sample as in Figure 1A. (B) Average NFR width difference between Native and SGD without or with the indicated remodelers. Bars show averages of “n” replicates, symbols show values of individual datasets. Data of one SGD replicate as in Figure 1A, and of one replicate for each sample with remodeler as in panel (A). (C) Composite nucleosome dyad distributions for SGD reconstituted without or with RSC (green and dark grey, respectively) relative to the midpoints of unique poly(dT) (left) or poly(dA) (right). These elements were defined as being ≥6 bp and occurring on the sense strand within NFRs. Only those TSS that had either poly(dT) or poly(dA) but not both on the sense strand were selected. Each trace corresponds to a merge of three replicates, one being the same as in panel (A). See also Figure S3A. (D) Illustration emphasizing the orientation and relative position of poly(dT) and poly(dA) tracts upstream of TSSs. See also Figure S3C. Directional removal of nucleosomes by RSC is illustrated with long black arrows relative to the short grey arrows. See also Figures S1 and S3B, and Tables S1, S2 and S3.
Figure 3
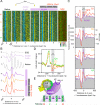
Figure 3. INO80 alone positions +1 nucleosomes, potentially through a combination of DNA sequence and shape features
(A) See Figure 2A description. Rows (4,127) were sorted based by increasing effectiveness of +1 positioning by INO80 relative to SGD, i.e., ratio of tags in a 60 bp window centered on +1 dyad locations (defined in vivo) between reactions containing and lacking INO80 (graphs 4 vs. 2, indicated by linked triangles). Graph 7 shows corresponding NPS correlation scores (Ioshikhes et al., 2006) of 4071 genes. Red and green reflect positive and negative correlations, respectively. Data for the Native sample as in Figure 1A. Data for samples 2 and 4 as in Figure 2A. See also Figure S4D. (B) Composite plots of data in panel (A). (C) Composite plots of data shown in graphs 2, 4 and 7 in panel (A), separated into quartiles Q1-Q4 based on panel (A) sorting. In panels (C) and (D), the 147 bp region covered by +1 nucleosomes is shaded. (D) Composite plot of intrinsic local DNA helical twist calculated for Q1-Q4, based on DNA sequence (Zhou et al., 2013). See also Figure S4A, B, C,F, G. (E) Model of how INO80 might position +1 nucleosomes by using DNA sequence (e.g., AA dinucleotides constituting NPSs) and shape (e.g., over-/under-twist) features. The illustrated untwisting of DNA by INO80 is exaggerated for emphasis.
Figure 4
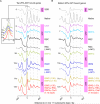
Figure 4. INO80 shows enhanced spacing activity and cooperates with ISW1a in the context of extracts
(A) See Figure 1A description. Data for samples Native, 2, 3 and 4 as in Figure 1A. (B) Composite plots of data shown in panel (A) with independent replicates 5b and 6b. See also Figure S1, and Tables S1, S2 and S3.
Figure 5
Figure 5. Abf1 and combinations of remodelers create near-canonical NFR/+1/array organization at Abf1-bound genes
(A) and (B) Composite plots of indicated reconstitution reactions. Data for samples Native, 3, and 4 are as in Figure 2A. For corresponding heat maps see Figure S5A. Composites represent either the top (A) or bottom (B) 25% of all genes sorted by Abf1 ChIP-exo occupancy measured in vivo in YPD media (see also Figure S3C). The latter essentially being unbound in vivo, but potentially having some promiscuous binding in vitro. Dashed graphs lack Abf1. Inset shows a zoom-in of +1 nucleosomes for selected graphs. See also Figures S1 and S5B, and Tables S1, S2 and S3.
Figure 6
Figure 6. Reb1 and combinations of remodelers create proper NFR/+1 organizations at Reb1-bound genes
(A) See Figure 2A description (also organized as in Figure S5A, except using Reb1 instead of Abf1). Rows (4,168) were sorted by Reb1 ChIP-exo occupancy measured in vivo in YPD media (graph 1, red triangle, see also Figure S3C). Data for samples Native, 3 and 4 were the same as in Figure 2A. (B) Composite plots of data in panel (A). Dashed graphs lack Reb1. (C) Samples with same number as in panel (B) show same data, others independent replicates. Color intensity of graphs scales with amount of remodeler used (Table S3). See also Figure S1, and Tables S1, S2 and S3.
Figure 7
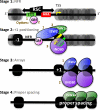
Figure 7. Model depicting the proposed four basic stages in nucleosome organization at the 5’ ends of genes
Brown numbers denote different options that may occur to varying degrees at each gene. GRFs and DNA sequence are gene-specific and so impart differing gene-selective utilization of remodelers and mechanisms. Nucleosomes are either depicted in black or grey signifying defined or fuzzy positioning, respectively. Stage 1, NFRs are formed through directional nucleosome displacement by RSC as guided by poly(dT)/poly(dA) tracts and/or by GRF-mediated RSC action. GRF binding is to cognate sites (not shown) rather than to poly(dT). INO80 may also generate NFRs (option 3, not depicted). Stage 2, the +1 nucleosome is set by ISW2 or ISW1a in cooperation with GRFs and/or by INO80 recognizing unique DNA sequence (NPS in yellow) and shape (helical twist in green) features at +1. Stage 3, both ISW2 and INO80 generate nucleosomal arrays aligned by the +1 nucleosome, but with non-canonically wide spacing. Stage 4, ISW1a properly spaces these nucleosomes leading to physiological arrays. At present, we make no assumption regarding the temporal order of events.

Comment in

References

    1. Albert I, Wachi S, Jiang C, Pugh BF. GeneTrack--a genomic data processing and visualization framework. Bioinformatics. 2008;24:1305–1306. - PMC - PubMed
    1. Badis G, Chan ET, van Bakel H, Pena-Castillo L, Tillo D, Tsui K, Carlson CD, Gossett AJ, Hasinoff MJ, Warren CL, et al. A library of yeast transcription factor motifs reveals a widespread function for Rsc3 in targeting nucleosome exclusion at promoters. MolCell. 2008;32:878–887. - PMC - PubMed
    1. Bartholomew B. Regulating the chromatin landscape: structural and mechanistic perspectives. Annu Rev Biochem. 2014;83:671–696. - PMC - PubMed
    1. Chang GS, Noegel AA, Mavrich TN, Muller R, Tomsho L, Ward E, Felder M, Jiang C, Eichinger L, Glockner G, et al. Unusual combinatorial involvement of poly-A/T tracts in organizing genes and chromatin in Dictyostelium. Genome research. 2012;22:1098–1106. - PMC - PubMed
    1. de Boer CG, Hughes TR. Poly-dA:dT tracts form an in vivo nucleosomal turnstile. PloS one. 2014;9:e110479. - PMC - PubMed

Publication types

MeSH terms