. 2016 Oct 21;13(1):177.
doi: 10.1186/s12985-016-0637-9.

Activation of HIV-1 expression in latently infected CD4+ T cells by the small molecule PKC412

Affiliations

Activation of HIV-1 expression in latently infected CD4+ T cells by the small molecule PKC412

Zhujun Ao et al. Virol J. .

Abstract

Background: HIV-1 latency is a major obstacle for HIV-1 eradication. Extensive efforts are being directed toward the reactivation of latent HIV reservoirs with the aim of eliminating latently infected cells via the host immune system and/or virus-mediated cell lysis.

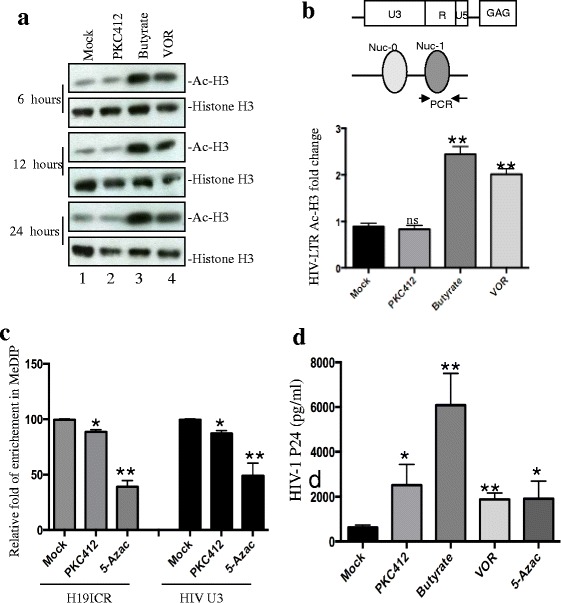
Results: We screened over 1,500 small molecules and kinase inhibitors and found that a small molecule, PKC412 (midostaurin, a broad-spectrum kinase inhibitor), can stimulate viral transcription and expression from the HIV-1 latently infected ACH2 cell line and primary resting CD4+ T cells. PKC412 reactivated HIV-1 expression in ACH2 cells in a dose- and time-dependent manner. Our results also suggest that the nuclear factor κB (NF-κB) signaling could be one of cellular pathways activated during PKC412-mediated activation of latent HIV-1 expression. Additionally, combining PKC412 with the HDAC inhibitor vorinostat (VOR) had an additive effect on HIV-1 reactivation in both ACH2 cells and infected resting CD4+ T cells.

Conclusions: These studies provide evidence that PKC412 is a new compound with the potential for optimization as a latency-reactivator to eradicate HIV-1 infection.

Keywords: ACH2 cells; HIV latency; NF-κB signaling; PKC412; Resting CD4+ T cells.


Figures

Fig. 1
Fig. 1
PKC412 stimulates HIV-1 expression in latently infected ACH2 cells. a A over 1,500 small molecules and kinase inhibitors were tested in HIV latently infected ACH2 cells in 96-well plates at a final concentration of 2 μM. After two days, the HIV-1 p24 level in each well was measured by ELISA. b PKC412 chemical structure. c ACH2 cells cultured in RPMI medium containing 1 % or 10 % FBS were treated with PKC412 at different concentrations for 48 h; then, HIV p24 production was measured in the cell culture supernatants. Error bars represent variations between duplicate samples and the data are representative of results obtained in three independent experiments. d Assessment of PKC412 cytotoxicity by the trypan blue dye exclusion assay. ACH2 cells in 1 % or 10 % FBS medium and human resting CD4+ T cells were treated with different PKC412 concentrations. After 48 h, the cells were assessed using the trypan blue dye exclusion assay and counted using a TC20 Automated Cell Counter. Error bars represent variation between duplicate samples and the data are representative of results obtained in three independent experiments
Fig. 2
Fig. 2
Pulse PKC412 treatment stimulates HIV-1 expression in ACH2 cells. ACH2 cells were pulse-treated with PKC412 (0.5 μM) for 8, 12, 16, 24, or 48 h. PMA (2 ng/ml) or DMSO-treated cells were used as the positive and negative controls, respectively. a After 24 h, the cells were fixed and labeled with an anti-HIV-1 p24 antibody/anti-mouse IgG-FITC antibody and visualized under the fluorescence microscope (10× magnification). b After 48 h, the cells were lysed and analyzed by SDS-PAGE followed by Western blotting with anti-HIV-1 gp120, anti-HIV-1 p24, and anti-tubulin antibodies. c The HIV p24 levels in supernatants were quantified using an HIV-1 p24 ELISA kit after 48 h. d ACH2 cells were incubated with RPMI medium (1 % FBS) containing different PKC412 concentrations. After 48 h, total RNA was extracted from the PKC412-treated or untreated ACH2 cells and HIV transcription was measured by real-time PCR using primers corresponding to the HIV 5′LTR and gag (R-gag). Transcription activity was calculated as the relative HIV-1 mRNA level by setting the HIV-1 mRNA level in the control ACH2 cells (without PKC412 treatment) to 1 arbitrary unit. Error bars represent variations between triplicate samples and the data are representative of results obtained in three independent experiments. The degree of significance for PKC412 treatment was relative to DMSO treatment. * p < 0.05, ** p < 0.01
Fig. 3
Fig. 3
The effect of PKC412 on HIV-1 re-activation is independent of PKC412-induced cell cycle G2 arrest. a ACH2 cells were treated with PKC412 (0.5 μM) for 24 h and the cell cycle profiles were measured by staining with propidium iodide (PI) and analyzed with flow cytometry. b After 24 or 48 h, the cells were fixed and visualized under a microscope (20× magnification). c ACH2 cells were treated with aphidicolin (2 μM) for 12 h and then PKC412 (0.5 μM) for another 24 h. The cell cycle profiles of the ACH2 cells were analyzed with flow cytometry. The plot shows cells in G0/G1 phase (Green), S phase (yellow) and G2/M phase (blue). d ACH2 cells were treated with aphidicolin (2 μM) and PKC412 (0.5 μM) alone or in combination. After 48 h, the HIV-1 p24 level in each well was measured by HIV-1 p24 ELISA. Error bars represent variations between duplicate samples and the data are representative of results obtained in three independent experiments. The results were significant (* p < 0.05 and ** p < 0.01) compared to the mock treated cells
Fig. 4
Fig. 4
PKC412 reactivation is not associated with chromatin modulation. a Western blotting detection of acetylated histone H3 levels in latently infected cells. ACH2 cells were mock treated or treated with PKC412 (0.5 μM), butyrate (5 mM) or VOR (330 nM) and the cells were collected at different time points. Western blotting analysis was performed with anti-acetyl-histone H3 and anti-histone H3 antibodies. b The diagram shows the positions of the nucleosomes bound to the HIV-1 LTR and the location of the primers used for the real-time PCR in the ChIP assay (upper panel). Cells treated with or without PKC412 were assayed by ChIP with an anti-acetyl-histone H3 antibody. Immunoprecipitation with IgG served as the negative control. Cells treated with butyrate or VOR were used as the positive control. Real-time quantitation of the fold change relative to the negative control is shown (lower panel). c, d ACH2 cells were treated with PKC412 (0.5 μM) or the methyltransferase inhibitor 5-Azac (5 μM) for 24 h and the methylation levels of the H19 imprinted control region (ICR) and the HIV-1 LTR U3 region were detected by real-time PCR using specific primers following MeDIP ChIP with anti-5-methlcytosine (c). HIV-1 productions were measured with an HIV-1 p24 ELISA kit (d). Error bars represent variations between duplicate samples and the data are representative of results obtained in two independent experiments. The results were significant (* p < 0.05 and ** p < 0.01) compared to the mock treated cells
Fig. 5
Fig. 5
PKC-412 activates the NF-kappa B signaling pathway. The 293 T cells (a), A3.01 cells (b), and resting PBMCs (d) were transduced by Cignal Lenti particles encoding a luciferase (luc) gene under the control of a minimal (m)CMV promoter (Promo) and tandem repeats of the NF-κB transcriptional response element (TRE). After being transduced, cells were treated with different concentrations of PKC412 and TNF-α for 12 h and activation of NF-κB signaling was detected by measuring the luc activity. d ACH2 cells were treated with various concentrations of PKC412 and TNF-α for 12 h, and then cells were fractionated into nuclear and cytoplasmic fractions. The nucleus- and cytoplasm-associated p65, histone-4 and β-tubulin were detected by WB with corresponding antibodies. e ACH2 cells were treated with various concentrations of PKC412 and TNF-α for 12 h. Then the cells were lysed, and Ser311phosphorylated p65 was detected by WB with corresponding antibody. Error bars represent variations between triplicate samples and the data are representative of results obtained in three independent experiments. The degree of significance for the PKC412 or TNF-α treatment was reported relative to the mock treatment. ** p < 0.01, *** p < 0.001, and **** p < 0.0001
Fig. 6
Fig. 6
Additive effect of PKC412 and VOR on the activation of latent HIV-1 expression. a ACH2 cells were treated with different concentrations of PKC412 and/or VOR. After 48 h, the activating effect of PKC412 and/or VOR on HIV expression was determined by measuring the HIV p24 level in the supernatants. b HIV transcript levels in ACH2 cells treated with PKC412 and/or VOR were measured with real-time PCR using primers corresponding to the HIV 5′LTR and gag (R-gag) and calculated as relative HIV-1 mRNA levels to non-treated ACH2 cells. c The schematic diagram of HIV infection in resting CD4+ T cells and the effects of PKC412 and/or VOR. d The infected resting CD4+ T cells from different donors were treated with PKC412 and/or VOR or untreated for 2 days. Then, the HIV Gag p24 levels from the supernatants were monitored by ELISA and calculated as relative P24 levels compared to the infected-untreated cells. The experiments were performed as triplicate repeats per assay for each donor. The mean values from each donor are shown with the standard error of the mean (SEM). The degree of significance for PKC412 or VOR treatment was relative to the infected-untreated cells. * p < 0.05, ** p < 0.01, *** p < 0.001, and **** p < 0.0001

References

    1. Eisele E, Siliciano RF. Redefining the viral reservoirs that prevent HIV-1 eradication. Immunity. 2012;37:377–388. doi: 10.1016/j.immuni.2012.08.010. - DOI - PMC - PubMed
    1. Williams SA, Kwon H, Chen LF, Greene WC. Sustained induction of NF-kappa B is required for efficient expression of latent human immunodeficiency virus type 1. J Virol. 2007;81:6043–6056. doi: 10.1128/JVI.02074-06. - DOI - PMC - PubMed
    1. Kilareski EM, Shah S, Nonnemacher MR, Wigdahl B. Regulation of HIV-1 transcription in cells of the monocyte-macrophage lineage. Retrovirology. 2009;6:118. doi: 10.1186/1742-4690-6-118. - DOI - PMC - PubMed
    1. Cary DC, Fujinaga K, Peterlin BM. Molecular mechanisms of HIV latency. J Clin Invest. 2016;126:448–454. doi: 10.1172/JCI80565. - DOI - PMC - PubMed
    1. Van Lint C. Role of chromatin in HIV-1 transcriptional regulation. Adv Pharmacol. 2000;48:121–160. doi: 10.1016/S1054-3589(00)48005-1. - DOI - PubMed

Publication types

MeSH terms

Grants and funding