Review
. 2016 Nov;20(11):843-856.
doi: 10.1016/j.tics.2016.09.003. Epub 2016 Oct 18.

Making Sense of Real-World Scenes

Affiliations
Review

Making Sense of Real-World Scenes

George L Malcolm et al. Trends Cogn Sci. 2016 Nov.

Abstract

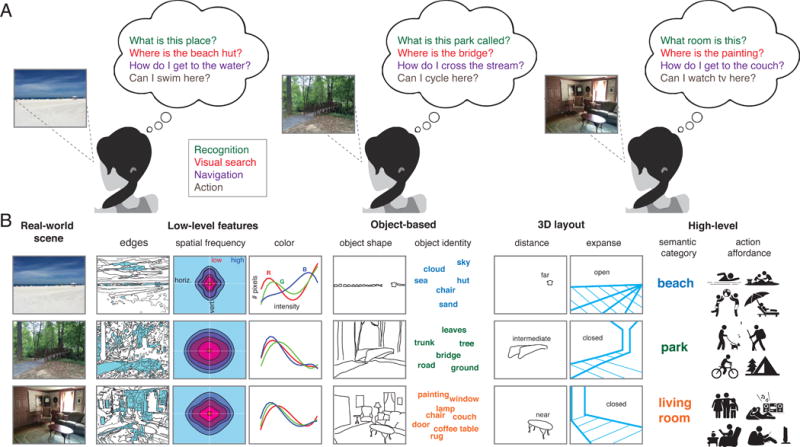
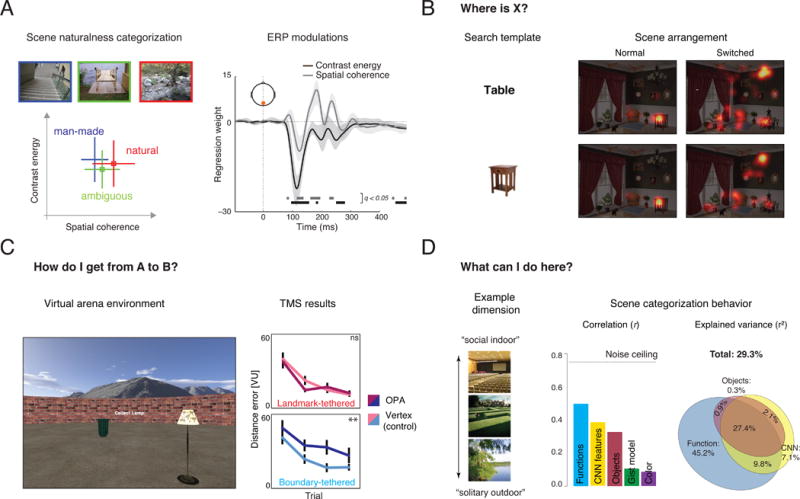
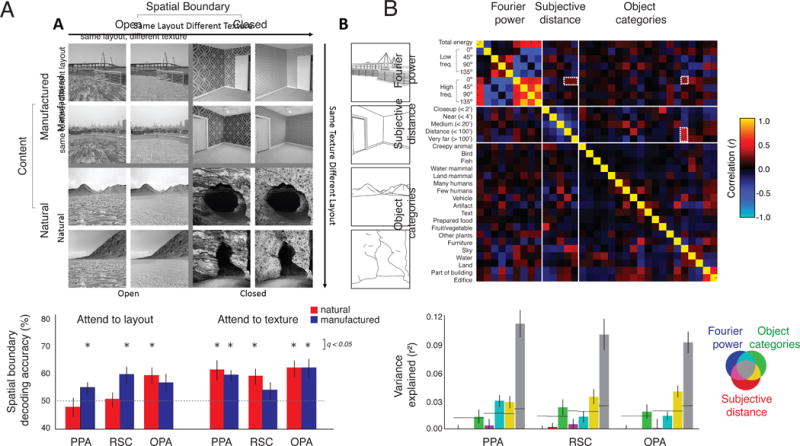
To interact with the world, we have to make sense of the continuous sensory input conveying information about our environment. A recent surge of studies has investigated the processes enabling scene understanding, using increasingly complex stimuli and sophisticated analyses to highlight the visual features and brain regions involved. However, there are two major challenges to producing a comprehensive framework for scene understanding. First, scene perception is highly dynamic, subserving multiple behavioral goals. Second, a multitude of different visual properties co-occur across scenes and may be correlated or independent. We synthesize the recent literature and argue that for a complete view of scene understanding, it is necessary to account for both differing observer goals and the contribution of diverse scene properties.


Figures

Figure 1
Figure 1. Observer goals and scene properties
A) Examples of possible observer goals in scene understanding. In this article, we focus on four general task domains that involve scene understanding: 1) recognition, i.e. determining whether a visual scene belongs to a certain category (e.g., beach scene), or depicts a particular place (the park, my living room); 2) visual search, which involves locating specific objects or other scene elements; 3) navigation, which involves determining both the navigability of the immediate space and one’s position relative to an unseen location; and 4) action goals, which may involve navigation but also encompass a broader set of activities such as cooking or playing baseball. B) Examples of scene properties that may be relevant for constructing mental representations necessary to achieve various observer goals. Properties that can be computed from scene images with relatively simple computational models, such as edges, spatial frequency and color, are considered ‘low-level features’. More complex properties are the scene’s constituent objects and 3D properties reflective of the layout of the scene, or the distance of the observer to salient elements in scenes. Finally, semantic category and action affordances can be seen as ‘high-level’ features of scenes that are not easily computed from scenes but may inform multiple observer goals. Note that scenes may differ from one another at multiple levels; for example, the beach scene can be distinguished from the park and living room based on virtually all dimensions, whereas the park and living room image share some but not all properties. Due to the inherent correlations between scene features, assessing their individual contributions to scene representations is challenging [125].
Figure 2
Figure 2. Mapping properties to goals
A) Recognizing a scene. Scenes that were easily categorized as man-made or natural resided at opposite ends of a low-level feature space described by two summary statistics of local contrast (see Box 3): contrast energy and spatial coherence, while ambiguous scenes were found in the middle of the space. These statistics also modulate evoked EEG responses in early stages of visual processing. Redrawn from data published in [13]. B) Locating information within a scene. Fixation density heat map during a visual search task. Participants combined precise search templates (object image, bottom row) and reliable spatial expectations (normal vs. switched arrangements, columns) to improve oculomotor efficiency. Reproduced, with permission, from [46]. C) Navigating through scenes. A virtual arena paradigm used to test contributions of landmark and boundary information. Participants learn target locations, which are tethered to a boundary or landmark location. Disruption of OPA with transcranial magnetic stimulation affected navigation with respect to boundaries but not with respect to landmarks. Modified with permission from [70]. D) Actions afforded by a scene. An empirically derived scene function feature space (containing, for example, a dimension separating solitary outdoor activities from social indoor activities) correlated more strongly with scene categorization behaviour than various other models of scene properties, including object labels, CNN representations, and low-level feature models. The variance explained by the function space was partly unique and partly shared with the other models. Modified, with permission, from [78].
Figure 3
Figure 3. Investigating multiple properties and goals
A) Dynamic coding of scene properties. Four different scene categories were created by systematically varying spatial boundary (open vs. closed) and scene content (natural vs. manufactured), and each category contained twelve unique structural layouts and twelve textures. Both scene content and a task manipulation (attend to layout or texture) modulated whether spatial boundary could be decoded from fMRI responses across multiple scene-selective areas. Modified, with permission, from [123]. B) Correlations between scene properties. Three models of scene properties were compared in terms of their inter-correlations and ability to predict fMRI responses in scene-selective cortex: 1) Fourier power at four major orientations, subdivided in low versus high frequencies, as well as a total energy measure; 2) Subjective distance to salient objects in the scene, divided in five different bins; and 3) Object labels, binned in 19 categories. Dashed white outlines indicate an example of high feature correlation between models: pictures containing sky tend to have far distance ratings and relatively high spatial frequency in the horizontal dimension, potentially due to the presence of a thin horizon line and tiny objects in faraway scenes (e.g., beaches; see also Figure 1B). As a result, most of the variance in response magnitude in scene-selective areas is shared across models: Venn diagram colors indicate variance explained by each model and their combinations, and grey shows shared variance across all three models. Adapted, with permission, from [125].

References

    1. Torralba Antonio, Oliva A. Statistics of natural image categories. Netw Comput Neural Syst. 2003;14:391–412. - PubMed
    1. Malcolm GL, et al. Beyond gist: strategic and incremental information accumulation for scene categorization. Psychol Sci. 2014;25:1087–1097. - PMC - PubMed
    1. Greene MR, et al. What you see is what you expect: rapid scene understanding benefits from prior experience. Atten Percept Psychophys. 2015;77:1239–1251. - PubMed
    1. Tversky B, Hemenway K. Categories of environmental scenes. Cogn Psychol. 1983;15:121–149.
    1. VanRullen R. Four common conceptual fallacies in mapping the time course of recognition. Front Psychol. 2011;2:1–6. - PMC - PubMed

LinkOut - more resources