. 2016 Dec;172(4):2445-2458.
doi: 10.1104/pp.16.01347. Epub 2016 Oct 21.

Cell-Type-Specific H+-ATPase Activity in Root Tissues Enables K+ Retention and Mediates Acclimation of Barley (Hordeum vulgare) to Salinity Stress

Affiliations

Cell-Type-Specific H+-ATPase Activity in Root Tissues Enables K+ Retention and Mediates Acclimation of Barley (Hordeum vulgare) to Salinity Stress

Lana Shabala et al. Plant Physiol. 2016 Dec.

Abstract

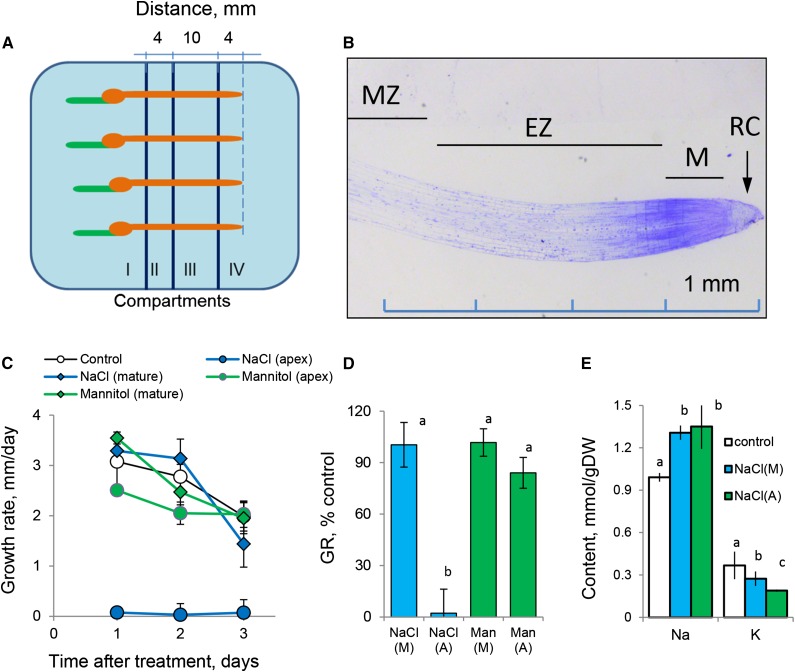
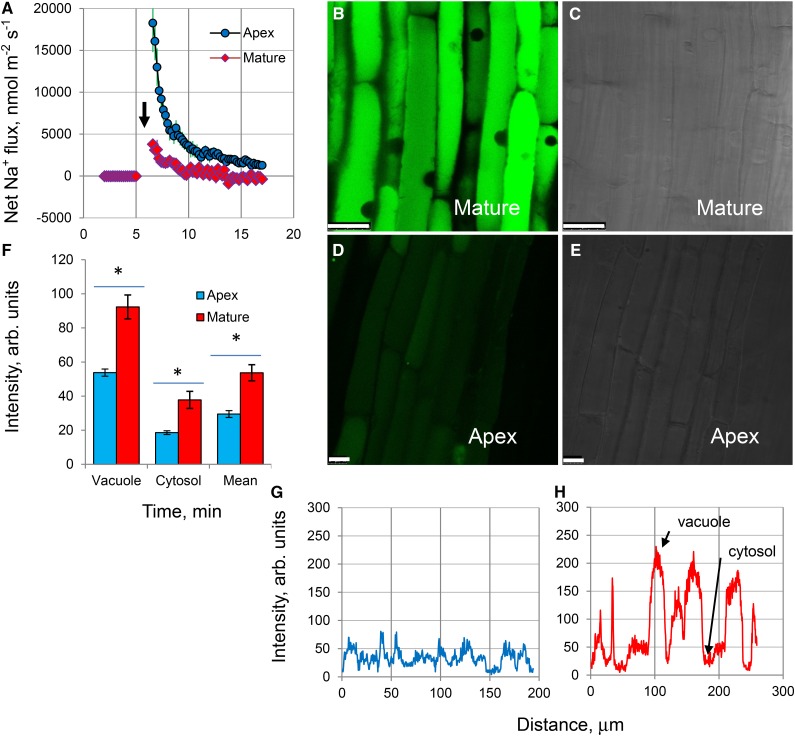
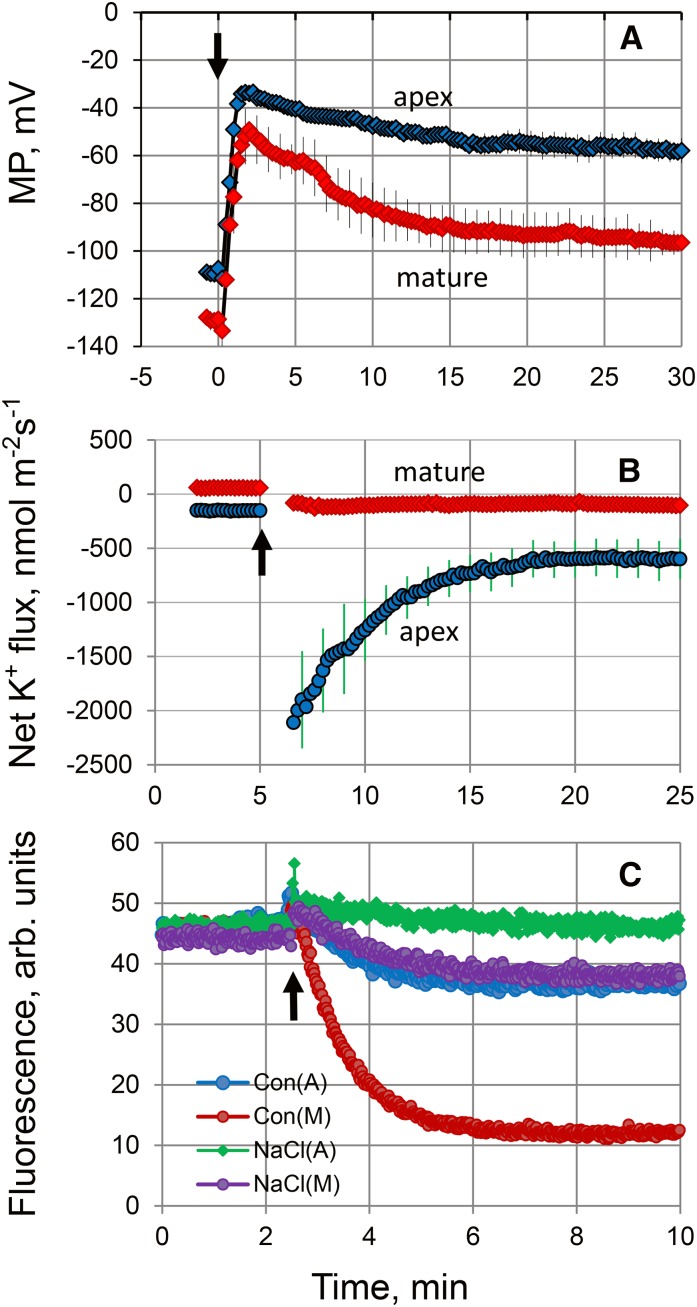
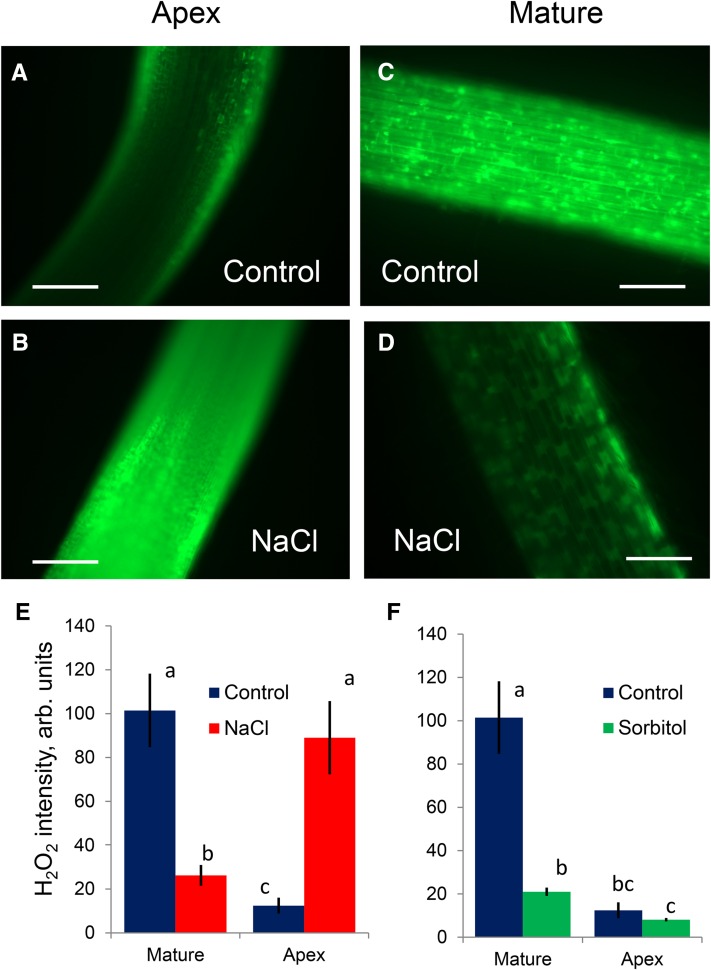
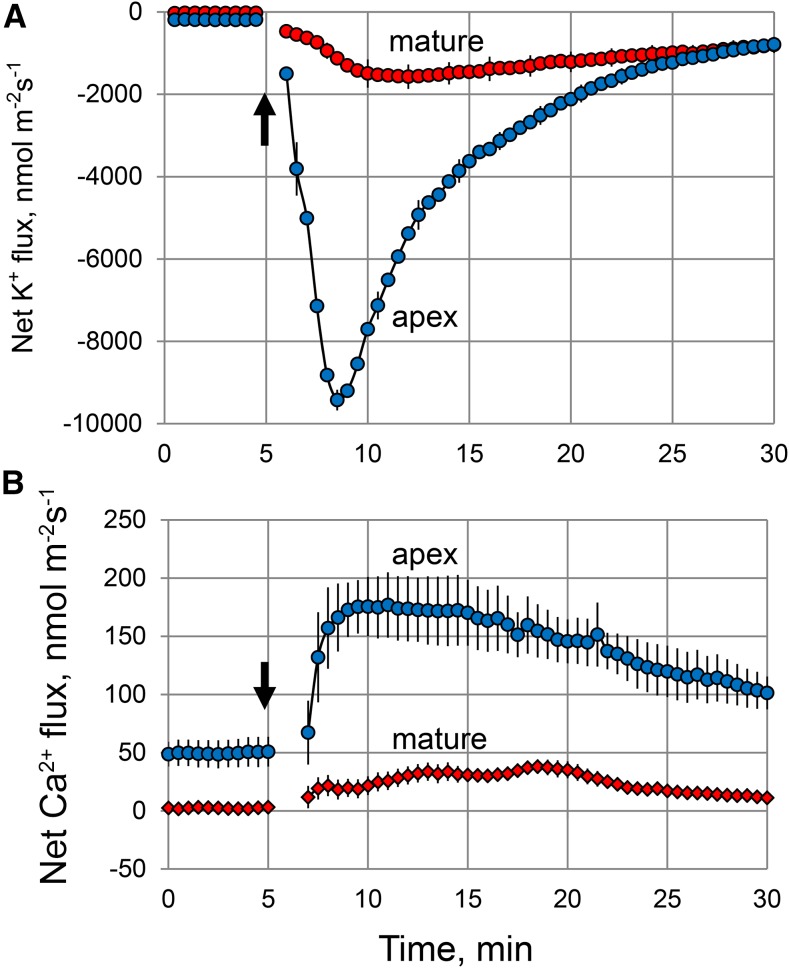
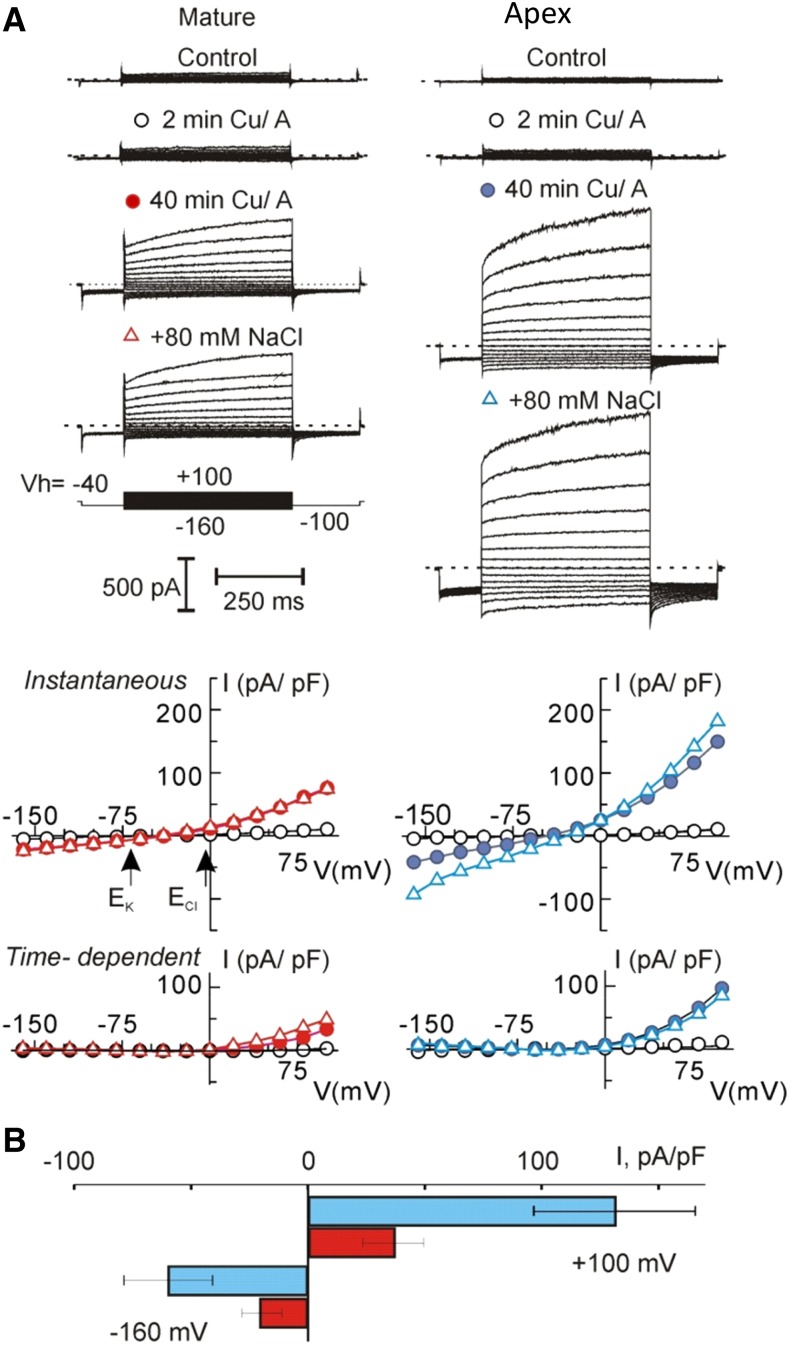
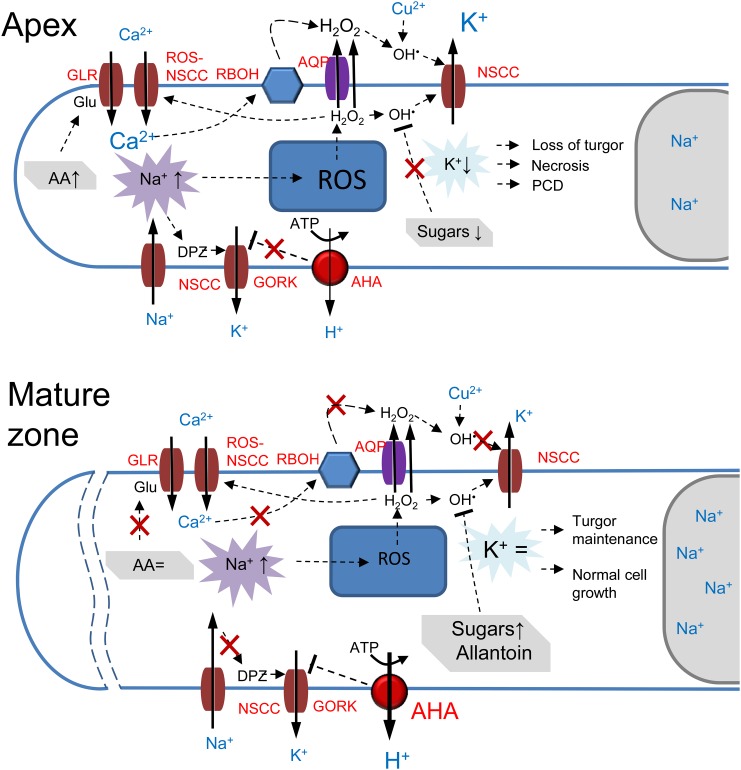
While the importance of cell type specificity in plant adaptive responses is widely accepted, only a limited number of studies have addressed this issue at the functional level. We have combined electrophysiological, imaging, and biochemical techniques to reveal the physiological mechanisms conferring higher sensitivity of apical root cells to salinity in barley (Hordeum vulgare). We show that salinity application to the root apex arrests root growth in a highly tissue- and treatment-specific manner. Although salinity-induced transient net Na+ uptake was about 4-fold higher in the root apex compared with the mature zone, mature root cells accumulated more cytosolic and vacuolar Na+, suggesting that the higher sensitivity of apical cells to salt is not related to either enhanced Na+ exclusion or sequestration inside the root. Rather, the above differential sensitivity between the two zones originates from a 10-fold difference in K+ efflux between the mature zone and the apical region (much poorer in the root apex) of the root. Major factors contributing to this poor K+ retention ability are (1) an intrinsically lower H+-ATPase activity in the root apex, (2) greater salt-induced membrane depolarization, and (3) a higher reactive oxygen species production under NaCl and a larger density of reactive oxygen species-activated cation currents in the apex. Salinity treatment increased (2- to 5-fold) the content of 10 (out of 25 detected) amino acids in the root apex but not in the mature zone and changed the organic acid and sugar contents. The causal link between the observed changes in the root metabolic profile and the regulation of transporter activity is discussed.


Figures

Figure 1.
Figure 1.
Barley root growth and responses to salinity (100 mm NaCl) and isotonic mannitol treatment. A, Schematic diagram depicting the experimental design and root immobilization within a multicompartment growth chamber (Supplemental Fig. S1). Salt was added to compartments II (mature zone) and IV (root apex). B, Anatomy of the barley root apex depicting functionally different root zones (modified from Shelden et al. [2016] with permission from Oxford University Press). EZ, Elongation zone; M, meristem; MZ, mature zone; RC, root cap. C, Root growth rate as a function of time after treatment. Values shown are means ± se (n = 8–12). D, Relative growth rate (GR; % of control). E, Total root Na+ and K+ content after 3 d of 100 mm NaCl application to either apical or mature root zones. Values shown are means ± se (n = 5–8). (A), Apex; DW, dry weight; (M), mature zone; Man, mannitol. Different lowercase letters indicate significant differences between treatments at P < 0.05.
Figure 2.
Figure 2.
Na+ uptake and accumulation in barley roots. A, Kinetics of net Na+ fluxes measured from the epidermal root cells in the apical and mature regions in response to 100 mm NaCl treatment (indicated by the arrow). Values shown are means ± se (n = 6–8). B and D, Na+ accumulation and intracellular distribution in mature (B) and apical (D) root zones visualized by the CoroNa Green fluorescent dye after 3 d of 100 mm NaCl treatment. One typical image (of eight) for each zone is shown. All images were taken using the same settings and exposure times to enable direct comparisons. C and E, Bright-field images of the corresponding zones for B and D, respectively. Bars in B to D = 25 μm. F, Mean CoroNa Green fluorescence intensity measured from cytosolic and vacuolar compartments. Values shown are means ± se (n = 70–300). Asterisks indicate significant differences between zones at P < 0.05. G and H, Typical examples of the spatial cross-sectional profiles of CoroNa Green fluorescence signals from roots in apical and mature root zones, respectively. Several lines were drawn across the so-called region of interest in an appropriate root zone, and continuous fluorescence intensity distribution profiles were obtained by LAS software and plotted.
Figure 3.
Figure 3.
Superior K+ retention in the mature root zone is attributed to an intrinsically higher rate of H+-ATPase extrusion activity. A, Changes in the plasma membrane (PM) potential in epidermal root cells in two different zones upon exposure to 100 mm NaCl (indicated by the arrow). Values shown are means ± se (n = 6–8). B, Net K+ fluxes measured from the epidermal root cells in the apical and mature zones in response to 100 mm NaCl treatment (indicated by the arrow). Values shown are means ± se (n = 7–10). C, H+ pumping measured by ACMA quenching. PMs containing the H+-ATPase were incubated with ATP, and H+ pumping was activated by the addition of Mg2+ (indicated by the arrow). This experiment is representative of three independent PM purifications.
Figure 4.
Figure 4.
Stress-induced ROS accumulation in barley roots visualized by 2′,7′-dichlorofluorescein diacetate staining (for details, see Rodrigo-Moreno et al., 2013). A to D, Representative images (out of eight) of mature (approximately 20 mm from the tip) and apical (2 mm) zones from control and salt-treated (100 mm NaCl for 24 h) roots. Bars = 200 μm. E, Average fluorescence signal intensity from the apical and mature root zones (in arbitrary units) for control and stressed roots. Values shown are means ± se (n = 8). F, As for E, but for roots treated with isotonic mannitol solution. Data labeled with different lowercase letters are significantly different at P < 0.05.
Figure 5.
Figure 5.
Net K+ (A) and Ca2+ (B) fluxes measured from epidermal root cells in response to an OH·-generating copper/ascorbate (0.3/1 mm) mixture applied at 5 min (indicated by the arrows). Values shown are means ± se (n = 6–8).
Figure 6.
Figure 6.
ROS induced nonselective current in protoplasts from elongation and mature root zones. A, Examples of whole-cell recordings of membrane currents, induced by OH· in two protoplasts of equal size (capacitance = 5.5 pF), isolated from mature or elongation root zones. Ionic concentrations are given in “Materials and Methods.” Respective current (I)/voltage (V) curves for instantaneous and time-dependent current components at the beginning of treatment (2 min), 40 min after, and after a subsequent addition of 80 mm NaCl are presented. Arrows indicate equilibrium potentials for K+ and Cl for standard bath and pipette solutions. Cu/A, Copper/ascorbate. B, Mean density of total (instantaneous plus time-dependent) inward and outward ROS-induced currents, measured at −160 mV and +100 mV, respectively, after 40 min of treatment in a standard bath solution. Values shown are means ± se; n = 18 and 15 for elongation and mature zones, respectively.
Figure 7.
Figure 7.
Effects of root pretreatment with 1 mm allantoin (for 24 h) on K+ flux responses measured from epidermal root cells in the elongation zone upon exposure to salinity and oxidative stresses. A, Transient net K+ flux kinetics in response to 10 mm H2O2. B, Peak K+ flux values caused by acute salinity (100 mm NaCl) and oxidative (10 mm H2O2) stresses. Values shown are means ± se (n = 5–6). Asterisks indicate significant differences compared with the nonpretreated control at P < 0.05.
Figure 8.
Figure 8.
A model to explain the differential sensitivity to salt stress between apical and mature root tissues. Abbreviations in red define specific PM transporters involved: APA, P2B-type H+-ATPase; AQP, aquaporin; RBOH, NADPH oxidase. A, In the root apex, Na+ transport across the PM is mediated by NSCC and results in a significant membrane depolarization (DPZ), leading to GORK activation and a massive efflux of K+ from the cytosol. Increased Na+ uptake also results in an increased ROS (H2O2) production in mitochondria. H2O2 then moves to the cytosol and is transported to the apoplast (cell wall) either by diffusion or via aquaporin, where it interacts with the transition metal (Cu2+ in the model), resulting in the formation of OH·. The latter activates NSCC from the apoplastic side, resulting in further K+ loss from the cell. The cytosolic mode of NSCC activation by OH· also is possible. Elevation in cytosolic Na+ also results in an elevated cytosol-free Ca2+ pool and stimulates NADPH oxidase activity, resulting in a further increase in H2O2 accumulation in the apoplast. Stress-induced increases in the amino acid (AA) pool (and, specifically, in Glu) stimulates additional Ca2+ uptake via GLR, leading to more H2O2 production by NADPH oxidase. The massive K+ loss mediated by these three concurrent mechanisms results in the loss of cell turgor (and, hence, root growth arrest) and, depending on the severity of salt stress, either programmed cell death (PCD) or necrosis in the root apex. B, In the mature root zone, intrinsically higher H+-ATPase activity reduces the extent of depolarization and prevents the activation of GORK. The observed increase in the sugar levels ensures efficient nonenzymatic scavenging of OH·, thus preventing K+ efflux via OH·-activated NSCC. The ROS-induced activation of K+ efflux pathways also is prevented by allantoin. The constant level of the amino acid pool ensures the absence of the activation of GLR and results in a lesser formation of H2O2 by NADPH oxidase. Together with the higher vacuolar Na+ content, these cells maintain normal turgor and metabolism and do not undergo programmed cell death.

References

    1. Adem GD, Roy SJ, Zhou M, Bowman JP, Shabala S (2014) Evaluating contribution of ionic, osmotic and oxidative stress components towards salinity tolerance in barley. BMC Plant Biol 14: 113. - PMC - PubMed
    1. Anschütz U, Becker D, Shabala S (2014) Going beyond nutrition: regulation of potassium homoeostasis as a common denominator of plant adaptive responses to environment. J Plant Physiol 171: 670–687 - PubMed
    1. Bose J, Rodrigo-Moreno A, Lai D, Xie Y, Shen W, Shabala S (2015) Rapid regulation of the plasma membrane H+-ATPase activity is essential to salinity tolerance in two halophyte species, Atriplex lentiformis and Chenopodium quinoa. Ann Bot (Lond) 115: 481–494 - PMC - PubMed
    1. Chen Z, Newman I, Zhou M, Mendham N, Zhang G, Shabala S (2005) Screening plants for salt tolerance by measuring K+ flux: a case study for barley. Plant Cell Environ 28: 1230–1246
    1. Chen Z, Pottosin II, Cuin TA, Fuglsang AT, Tester M, Jha D, Zepeda-Jazo I, Zhou M, Palmgren MG, Newman IA, et al. (2007) Root plasma membrane transporters controlling K+/Na+ homeostasis in salt-stressed barley. Plant Physiol 145: 1714–1725 - PMC - PubMed

Publication types

MeSH terms

LinkOut - more resources