. 2017 Jan;131(2):233-244.
doi: 10.1007/s11060-016-2298-3. Epub 2016 Oct 21.

Comprehensive proteome profiling of glioblastoma-derived extracellular vesicles identifies markers for more aggressive disease

Affiliations

Comprehensive proteome profiling of glioblastoma-derived extracellular vesicles identifies markers for more aggressive disease

Duthika M Mallawaaratchy et al. J Neurooncol. 2017 Jan.

Abstract

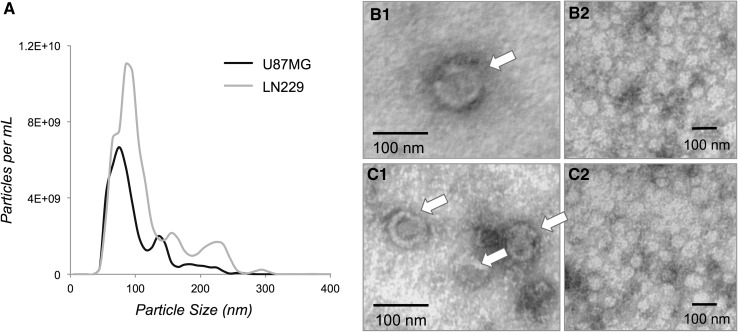
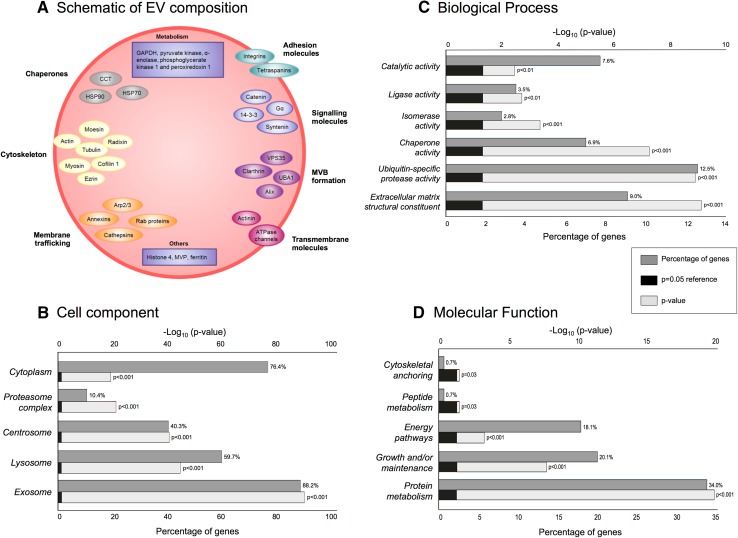
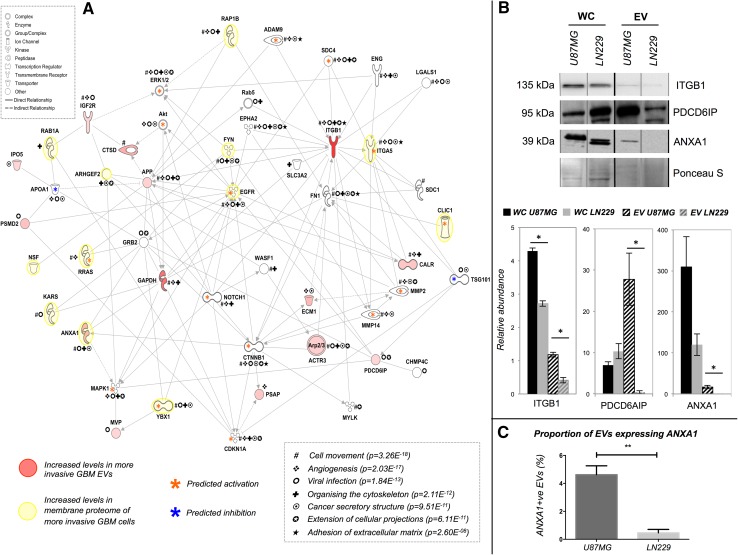
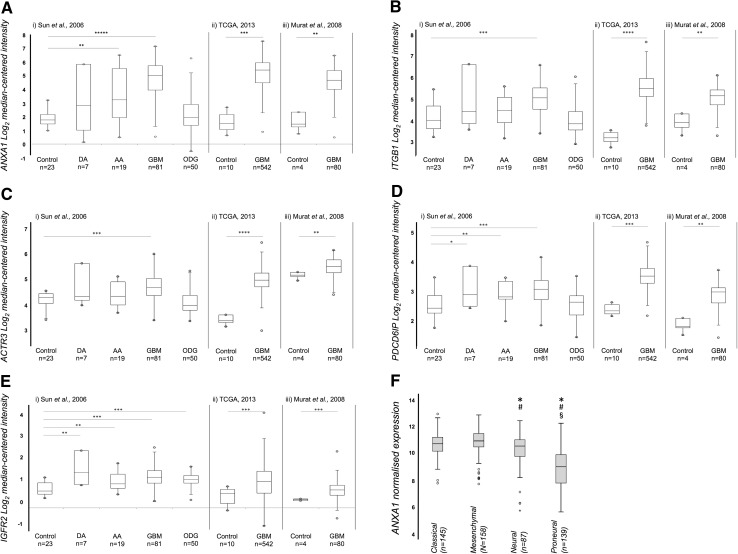
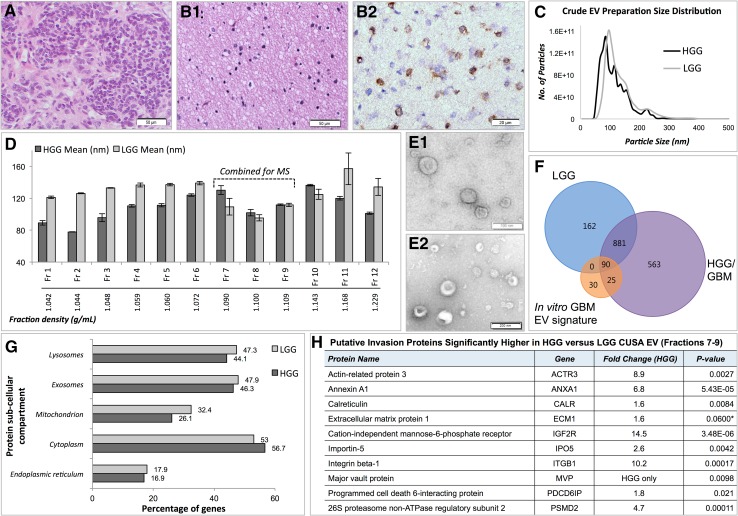
Extracellular vesicles (EVs) play key roles in glioblastoma (GBM) biology and represent novel sources of biomarkers that are detectable in the peripheral circulation. Despite this notionally non-invasive approach to assess GBM tumours in situ, a comprehensive GBM EV protein signature has not been described. Here, EVs secreted by six GBM cell lines were isolated and analysed by quantitative high-resolution mass spectrometry. Overall, 844 proteins were identified in the GBM EV proteome, of which 145 proteins were common to EVs secreted by all cell lines examined; included in the curated EV compendium (Vesiclepedia_559; http://microvesicles.org ). Levels of 14 EV proteins significantly correlated with cell invasion (invadopodia production; r2 > 0.5, p < 0.05), including several proteins that interact with molecules responsible for regulating invadopodia formation. Invadopodia, actin-rich membrane protrusions with proteolytic activity, are associated with more aggressive disease and are sites of EV release. Gene levels corresponding to invasion-related EV proteins showed that five genes (annexin A1, actin-related protein 3, integrin-β1, insulin-like growth factor 2 receptor and programmed cell death 6-interacting protein) were significantly higher in GBM tumours compared to normal brain in silico, with common functions relating to actin polymerisation and endosomal sorting. We also show that Cavitron Ultrasonic Surgical Aspirator (CUSA) washings are a novel source of brain tumour-derived EVs, demonstrated by particle tracking analysis, TEM and proteome profiling. Quantitative proteomics corroborated the high levels of proposed invasion-related proteins in EVs enriched from a GBM compared to low-grade astrocytoma tumour. Large-scale clinical follow-up of putative biomarkers, particularly the proposed survival marker annexin A1, is warranted.

Keywords: Annexin a1; Exosome; Extracellular vesicle; Glioblastoma; Invadopodia; Proteomics.


Figures

Fig. 1
Fig. 1
Characterization of GBM-derived EVs. a Size distribution of U87MG and LN229 EVs; traces represent triplicate experiments. Micrographs of (b1, b2) U87MG and (c1, c2) LN229 EV preparations show vesicles (indicated by arrows) with diameters of approximately 100 nm
Fig. 2
Fig. 2
a Schematic of GBM-derived EV protein composition. Molecules are grouped based on their function or protein subclass determined by IPA. Identified EV proteins are involved in membrane trafficking and fusion processes including Ras-related protein 10 (Rab10), Rab7a, Rab5c, annexins A1, A2, A4, A5, A6, A11, cathepsins b and d (CTSB, CTSD), EH domain-containing protein 1, (EHD1), tripeptidyl-peptidase 2 (TPP2), and are markers for endosomes and lysosomes. Other protein groups include chaperones heat shock proteins (HSPA5, HSPA8, HSPA4, HSP90AB1, HSP90AA1, HSP90B1, HSPH1, HSPB1, HSPA1A, HSPA9), T-complex proteins (CCT2, CCT3, CCT4, TCP1, CCT7, CCT8, CCT5, CCT6A) and cytoskeletal proteins (α-actinin-1, α-actinin-4, myosin-9, α-tubulin-4a, actin and ezrin); cytosolic proteins are expected in EV profiles due to EV biogenesis and budding from the multivesicular body (MVB). Proteins involved in MVB formation, including exosomal marker, programmed cell death 6-interacting protein (PDCD6IP; ALIX) were also identified. Several transmembrane proteins were identified including integrins (β1, α3, αV) and CD44 as well as transporters, e.g., sodium/potassium-transporting ATPase subunit α1. Arp, actin related protein; MVP, major vault protein; Image adapted from [66]. bd FunRich annotations based on 145 EV proteins common to all six GBM cells
Fig. 3
Fig. 3
Interaction network EV proteins significantly correlated to GBM invasiveness. a Genes corresponding to 14 proteins were mapped in a network of 54 molecules using Ingenuity Pathway Analysis. Proteins with significantly higher levels in more invasive cells have red symbols. Asterisks highlight molecules associated with top scoring biological functions and canonical pathways, including tumour cell movement/invasion, cell-to-cell signalling, brain tumour/GBM signalling and formation and extension of cellular protrusions. b Confirmation of putative invasion-related EV protein changes. Whole cell (WC) and EV samples from the most (U87MG) and least (LN229) invasive cell lines were used to confirm significant abundance changes of ITGB1, PDCD6IP and ANXA1. Ponceau S blot stain was used as a loading control. Bar charts depict relative quantitation, where (*) indicates significance between the most and least invasive cells (p < 0.05) and error bars represent standard error of mean. c ANXA1 positive U87MG and LN229 EVs are shown as percentages of the total EV population, as measured by using a NanoSight CMOS camera and 532 nm laser in triplicate. Results represent the mean ± standard error of mean of three independent readings (**p < 0.01)
Fig. 4
Fig. 4
Tumour transcript levels of putative invasion markers in independent glioma patient cohorts. a ANXA1, b ITGB1 c ACTR3, d PDCD6IP and e IGFR2 levels [Human Genome U133 Plus 2.0 Arrays, cohorts (i) and (iii); Human Genome U133A Array, cohort (ii)]. Expression levels generated by Oncomine are displayed as log2-median-centred ratio box plots comparing normal brain tissue to GBM or other less aggressive glioma tumours. Data from three cohorts (i) Sun et al. [67], (ii) TCGA [68] (iii) Murat et al. [69], refer to Supplementary Tables 3 and 4 for details; n is the number of samples, open circles represent maximum and minimum values; error bars represent 1.5× interquartile range; *p < 0.05; **p < 0.01; ***p < 1E− 04; ****p < 1E− 11. ANXA1 levels were significantly higher in GBM compared with normal brain tissues across all three datasets, with 7.3-fold (p = 1.52E− 26), 11.7-fold (p = 2.50E−09) and 7.5-fold (p = 5.40E−04) increases in (i), (ii) and (iii), respectively. ANXA1 levels were also significantly higher in anaplastic astrocytomas (3.3-fold, p = 6.34E− 04), though to a lesser degree. ITGB1 levels were significantly higher in GBM compared with normal brain tissues across all three datasets, with 1.7-fold (p = 3.94E−07), 4.4-fold (p = 5.0E−12) and 5.1-fold (p = 5.0E−03) increases in (i), (ii) and (iii), respectively. ACTR3 levels displayed the same trend, with higher expression levels in GBM across all three datasets, with 1.4-fold (p = 1.25E−07), 2.9-fold (p = 6.66E− 13) and 1.6-fold (p = 0.007) increases in (i), (ii) and (iii), respectively. PDCD6IP mRNA levels were higher in GBM (1.4-fold, p = 2.25E− 05), diffuse astrocytoma (1.3-fold, p = 0.04), and anaplastic astrocytoma (1.3-fold, p = 0.009) compared with normal brain in dataset (i). Compared to normal brain, GBM PDCD6IP mRNA was increased by 2.3-fold (p = 2.16E−11) in dataset (ii), and 2.1-fold (p = 5.90E−04) in dataset (iii). In dataset (i), IGF2R was significantly higher across four glioma subtypes compared to normal brain tissues, i.e., GBM (1.5-fold, p = 4.61E−11), diffuse astrocytoma (1.7-fold, p = 0.007), anaplastic astrocytoma (1.2-fold, p = 0.003), and oligodendroglioma (1.3-fold, p = 6.20E−07). In dataset (ii), IGF2R expression was higher in GBM compared to normal brain (1.6-fold increase p = 6.51E−05) and the same trend was observed in (iii) where IGF2R expression was 1.4-fold higher in GBM compared with normal brain tissue (p = 1.29E−11). f Box plots representing ANXA1 normalised gene expression across the TCGA GBM classical, mesenchymal, neural and proneural transcriptional subtypes. Open circles represent maximum and minimum outlier values; error bars represent 1.5× interquartile range; (*) significant expression change relative to the classical subtype (vs. neural, p = 0.004; vs. proneural, p = 1.73E− 27); (#) significant relative to mesenchymal subtype (vs. neural, p = 6.76E− 05; vs. proneural, p = 2.02E− 31); (§) significant relative to the neural subtype (vs. proneural, p = 1.15E− 12)
Fig. 5
Fig. 5
Cavitron Ultrasonic Surgical Aspirator (CUSA) fluid collected during High Grade Glioblastoma (HGG) and Low Grade Glioma (LGG) Surgical Resections. Haematoxylin and Eosin stained sections of tissue fragments recovered from CUSA washings collected during (a) HGG (WHO2007 Grade IV primary GBM) and (b1) LGG (WHO2007 Grade II diffuse astrocytoma) surgeries (scale bar 50 µm). b2 The LGG tumour specimen was immuno-positive for IDH1 (R132H) mutation (scale bar 20 µm). c Nanosight particle tracking analysis showed size distributions of particles in crude EV preparations from fluid recovered from HGG and LGG CUSA washings. d Mean sizes (nm) of particles isolated from Optiprep™ ultracentrifugation density fractions (Fractions 1–12), and corresponding densities (g/mL). Error bars indicate the standard error of mean. Transmission electron microscopy showed morphologies consistent with vesicles in combined density fractions 7–9 from (e1) HGG (scale bar 100 µm) and (e2) LGG (scale bar 200 µm). f Venn diagram depicts overlap of proteins identified at 95 % confidence levels by mass spectrometry (MS) in fractions 7–9 from HGG and LGG preparations, with the in vitro GBM EV signature proteins. g FunRich generated bar chart reveals percentage of genes corresponding to identified proteins in HGG and LGG fractions 7–9 corresponding to sub-cellular compartments. h Quantitative mass spectrometry analysis revealed nine putative ‘invasion’ proteins significantly higher in HGG compared to LGG CUSA-enriched EVs, and one protein with borderline significance (*). Fold changes are relative to the HGG sample

References

    1. Thery C, Zitvogel L, Amigorena S. Exosomes: composition, biogenesis and function. Nat Rev Immunol. 2002;2:569–579. - PubMed
    1. Raposo G, Stoorvogel W. Extracellular vesicles: exosomes, microvesicles, and friends. J Cell Biol. 2013;200(4):373–383. doi: 10.1083/jcb.201211138. - DOI - PMC - PubMed
    1. Skog J, Wurdinger T, van Rijn S, Meijer DH, Gainche L, Sena-Esteves M, Curry WT, Jr., Carter BS, Krichevsky AM, Breakefield XO. Glioblastoma microvesicles transport RNA and proteins that promote tumour growth and provide diagnostic biomarkers. Nat Cell Biol. 2008;10(12):1470–1476. doi: 10.1038/ncb1800. - DOI - PMC - PubMed
    1. Kucharzewska P, Christianson HC, Welch JE, Svensson KJ, Fredlund E, Ringner M, Morgelin M, Bourseau-Guilmain E, Bengzon J, Belting M. Exosomes reflect the hypoxic status of glioma cells and mediate hypoxia-dependent activation of vascular cells during tumor development. PNAS. 2013;110(18):7312–7317. doi: 10.1073/pnas.1220998110. - DOI - PMC - PubMed
    1. Antonyak MA, Li B, Boroughs LK, Johnson JL, Druso JE, Bryant KL, Holowka DA, Cerione RA. Cancer cell-derived microvesicles induce transformation by transferring tissue transglutaminase and fibronectin to recipient cells. Proc Natl Acad Sci USA. 2011;108(12):4852–4857. doi: 10.1073/pnas.1017667108. - DOI - PMC - PubMed

Publication types

LinkOut - more resources