. 2017 Jan;65(1):32-43.
doi: 10.1002/hep.28873. Epub 2016 Nov 22.

Expression of scavenger receptor-AI promotes alternative activation of murine macrophages to limit hepatic inflammation and fibrosis

Affiliations

Expression of scavenger receptor-AI promotes alternative activation of murine macrophages to limit hepatic inflammation and fibrosis

Adam C Labonte et al. Hepatology. 2017 Jan.

Abstract

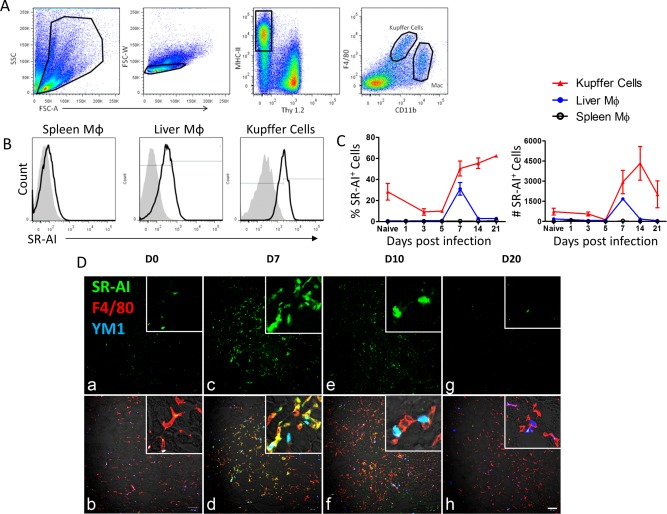
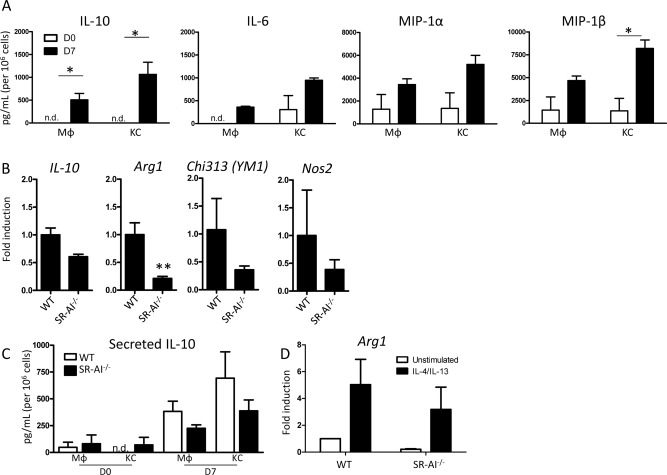
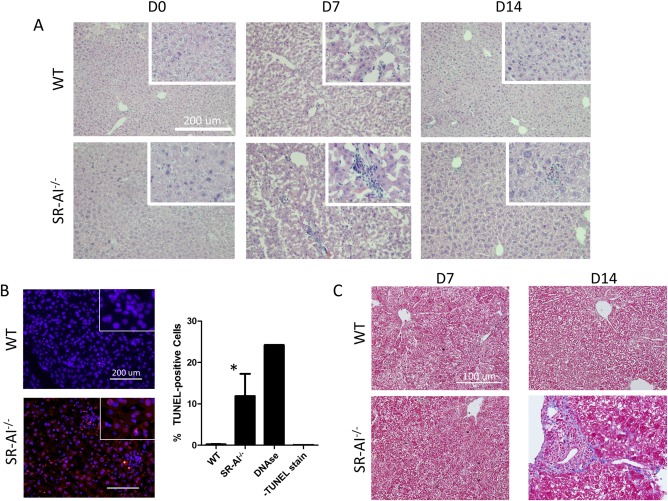
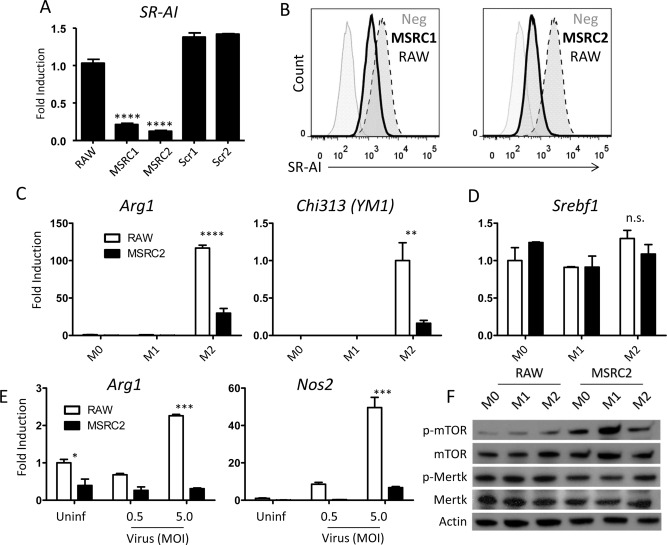
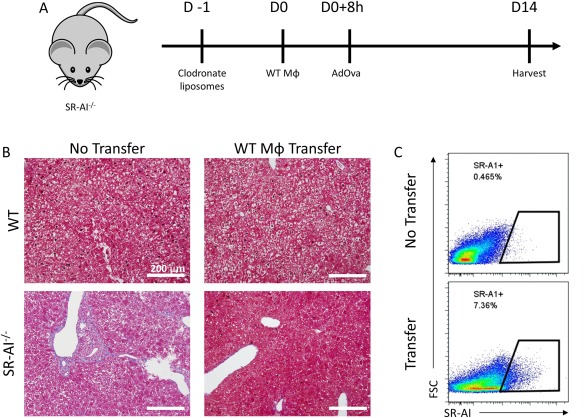
The liver maintains an immunologically tolerant environment as a result of continuous exposure to food and bacterial constituents from the digestive tract. Hepatotropic pathogens can take advantage of this niche and establish lifelong chronic infections causing hepatic fibrosis and hepatocellular carcinoma. Macrophages (Mϕ) play a critical role in regulation of immune responses to hepatic infection and regeneration of tissue. However, the factors crucial for Mϕ in limiting hepatic inflammation or resolving liver damage have not been fully understood. In this report, we demonstrate that expression of C-type lectin receptor scavenger receptor-AI (SR-AI) is crucial for promoting M2-like Mϕ activation and polarization during hepatic inflammation. Liver Mϕ uniquely up-regulated SR-AI during hepatotropic viral infection and displayed increased expression of alternative Mϕ activation markers, such as YM-1, arginase-1, and interleukin-10 by activation of mer receptor tyrosine kinase associated with inhibition of mammalian target of rapamycin. Expression of these molecules was reduced on Mϕ obtained from livers of infected mice deficient for the gene encoding SR-AI (msr1). Furthermore, in vitro studies using an SR-AI-deficient Mϕ cell line revealed impeded M2 polarization and decreased phagocytic capacity. Direct stimulation with virus was sufficient to activate M2 gene expression in the wild-type (WT) cell line, but not in the knockdown cell line. Importantly, tissue damage and fibrosis were exacerbated in SR-AI-/- mice following hepatic infection and adoptive transfer of WT bone-marrow-derived Mϕ conferred protection against fibrosis in these mice.

Conclusion: SR-AI expression on liver Mϕ promotes recovery from infection-induced tissue damage by mediating a switch to a proresolving Mϕ polarization state. (Hepatology 2017;65:32-43).


Figures

Figure 1
Figure 1
SR‐AI is up‐regulated on Mφ following hepatic viral infection. (A) Flow cytometry gating strategy for liver macrophages. Mononuclear cells were separated from whole‐liver homogenate by density gradient centrifugation, and live singlets were gated on Thy1.2MHC‐II+. F4/80hiCD11bmid cells were identified as liver‐resident Kupffer cells and F4/80midCD11bhi cells were identified as nonresident macrophages. (B) SR‐AI surface expression (black trace) versus isotype control (gray histogram) in spleen Mφ, liver Mφ, and KCs at day 7 postinfection. (C) Time course of frequency and number of SR‐AI+ cells (determined by gating on isotype control) during AdOVA infection. Data points are mean ± SEM of n=3 mice. (D) Immunofluorescence microscopy of sections from AdLacZ infected mouse liver at 0, 7, 10, and 20 days postinfection (100× magnification and scale bar = 100 μm; insert, ×200 magnification). Panels (A), (C), (E), and (G) show SR‐AI single‐surface staining in green; panels (B), (D), (F), and (H) show merged staining of SR‐AI (green), F4/80 (red), and YM1 (blue).
Figure 2
Figure 2
SR‐AI modulates Mφ activation upon viral insult. (A) Luminex quantification of cytokines and chemokines in supernatants collected from FACS‐sorted liver KCs and Mφ from infected WT mice following overnight culture. Data are mean ± SEM of n = 3 mice. (B) qPCR analysis for expression of M2‐related genes in Mφ‐enriched mononuclear cell fractions from WT and SR‐AI–/– livers on day 7 postinfection. Expression levels were calculated by the delta‐delta threshold cycle method and normalized to hypoxanthine guanine phosphoribosyl transferase expression; data are mean ± SEM for n = 3 mice. (C) Luminex data of IL‐10 levels in supernatants from sorted Mφ or KC from WT and SR‐AI–/– mice at day 7 postinfection. Data are mean ± SEM for n=3 mice. (D) Arginase 1 qPCR analysis of Mφ from infected WT or SR‐AI–/– livers cultured for 2 hours in either plain media or media with IL‐4 and IL‐13 to induce M2 polarization. Expression levels were calculated as in (A); data are mean ± SEM for n = 3 mice.
Figure 3
Figure 3
Infection‐induced tissue damage is more severe in the absence of SR‐AI. (A) H&E staining of liver sections obtained from WT and SR‐AI–/– mice 0, 7, or 14 days after tail vein injection of 5e7 PFU of AdOVA (100× magnification and scale bars = 200 μm; insert, ×200 magnification). Images are representative of three independent experiments. (B) Visualization of cell damage by TUNEL staining of WT and SR‐AI–/– liver sections 7 days postinfection (100× magnification and scale bars = 200 μm; insert, ×200 magnification). Staining was quantified by dividing the number of positive red stained cells by the total number of blue counterstained cells. Data are mean ± SEM; * P < 0.05 versus WT mice. (C) Trichrome staining for collagen in liver sections from WT and SR‐AI–/– mice 7 and 14 days postinfection (100× magnification and scale bars = 200 μm). Images are representative of three independent experiments.
Figure 4
Figure 4
Generation of a stable MSR knockdown cell line. (A) qPCR analysis of relative Msr1 expression in two subcultures of small interfering RNA (siRNA)‐transfected cells and two subcultures transfected with scrambled control plasmids. Expression levels were calculated by the delta‐delta threshold cycle method and normalized to hypoxanthine guanine phosphoribosyl transferase expression, then normalized to expression of untransfected RAW cells. Data are mean ± SEM for n = 3; **** P < 0.00005. (B) Flow analysis of SR‐AI expression after transfection with lentivirally packaged anti‐Msr1 siRNA. The bold trace represents transfected RAW cell subclones whereas the dotted trace represents WT RAW cells. (C,D) qPCR analysis comparing arg1, chi313, and srebf1 expression by stable knockdown MSRC2 cells to that of untransfected RAW cells. Expression levels were calculated as in (A). Data are mean ± SEM for n = 3; ** P < 0.005; **** P < 0.00005. (E) Arg1 and Nos2 gene expression of MSRC2 and untransfected RAW cells following overnight coculture with 0, 0.5 MOI, or 5.0 MOI of AdOVA in complete media. Expression levels were calculated as in (A); data are mean ± SEM for n = 3. (F) Western blotting of phosphorylated and total mTOR and Mertk from whole cell lysates of RAW or MSRC2 cells incubated for 2 hours in either plain media (M0), LPS (M1), or IL‐4 and IL‐13 (M2). Images are representative of three independent experiments. Abbreviation: p, phosphorylated.
Figure 5
Figure 5
Transfer of SR‐AI+ Mϕ protects against infection‐induced tissue damage. (A) Experimental design for adoptive BMDM transfer and infection. (B) Trichrome staining for collagen in liver sections from WT and SR‐AI–/– mice 14 days postinfection (100× magnification and scale bars = 200 μm). Images representative of 3 mice. (C) Confirmation of successful transfer of SR‐AI+ BMDMs into SR‐AI–/– mice by flow cytometry.

References

    1. Knolle PA, Gerken G. Local control of the immune response in the liver. Immunol Rev 2000;174:21–34. - PubMed
    1. Dustin LB, Cashman SB, Laidlaw SM. Immune control and failure in HCV infection—tipping the balance. J Leukoc Biol 2014;96:535–548. - PMC - PubMed
    1. Hoofnagle JH. Course and outcome of hepatitis C. Hepatology 2002;36(5 Suppl 1):S21–S29. - PubMed
    1. Manickam C, Reeves RK. Modeling HCV disease in animals: virology, immunology and pathogenesis of HCV and GBV‐B infections. Front Microbiol 2014;5:690. - PMC - PubMed
    1. Crispe IN. Immune tolerance in liver disease. Hepatology 2014;60:2109–2117. - PMC - PubMed

Publication types

Substances