. 2016 Oct 22:5:e18715.
doi: 10.7554/eLife.18715.

A computational interactome and functional annotation for the human proteome

Affiliations

A computational interactome and functional annotation for the human proteome

José Ignacio Garzón et al. Elife. .

Abstract

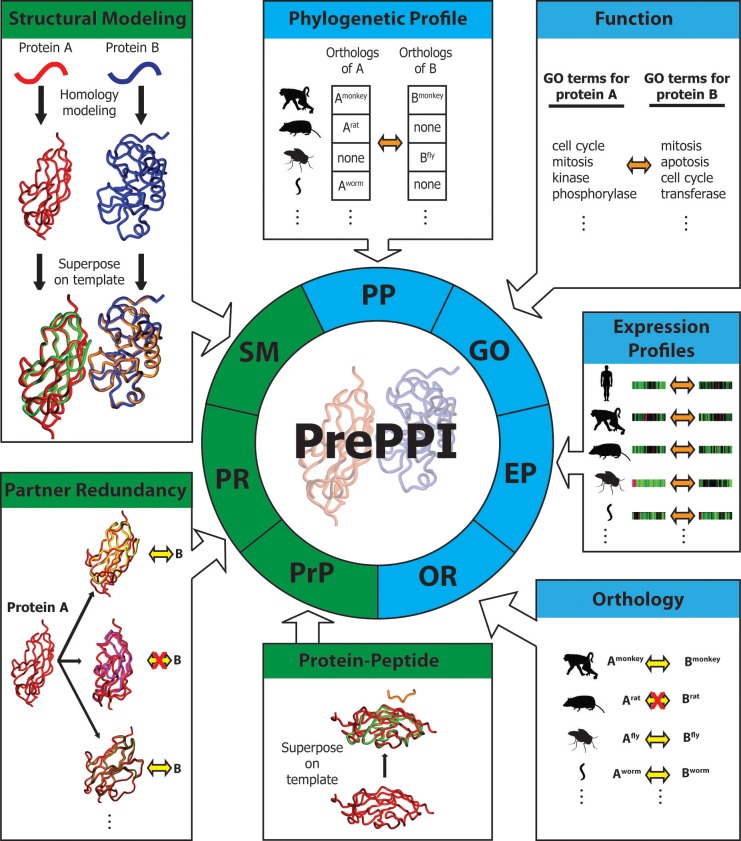
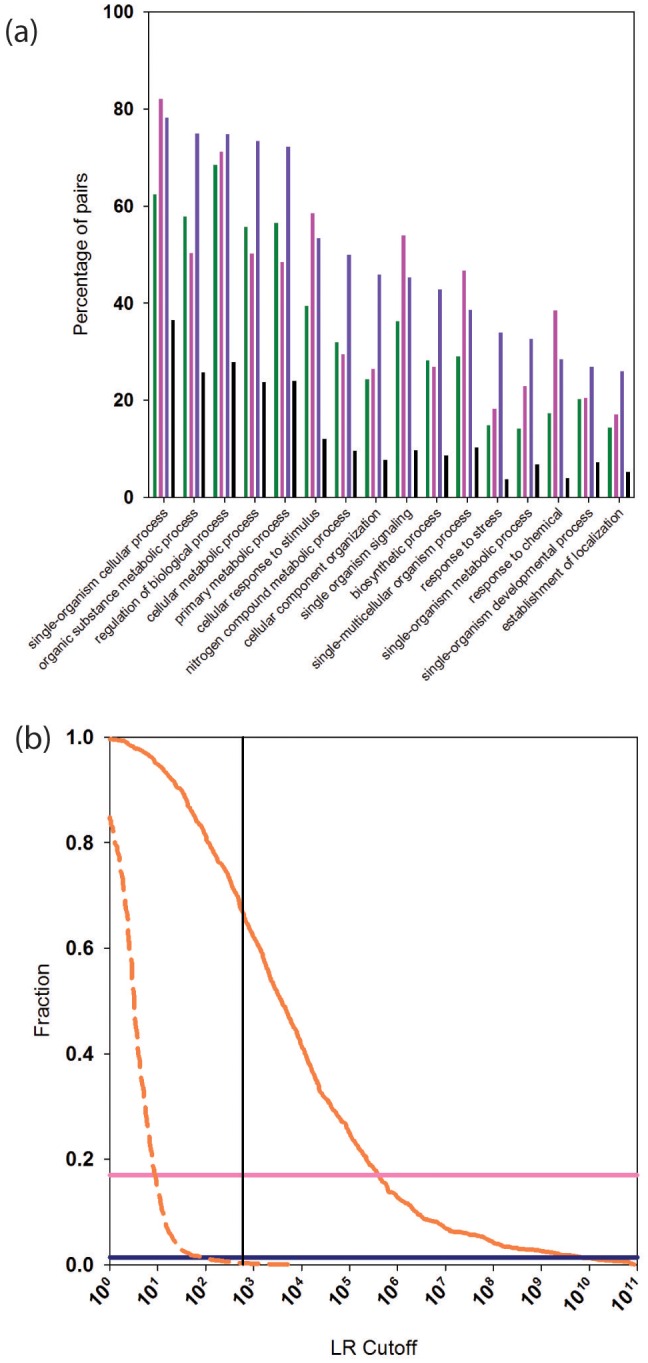
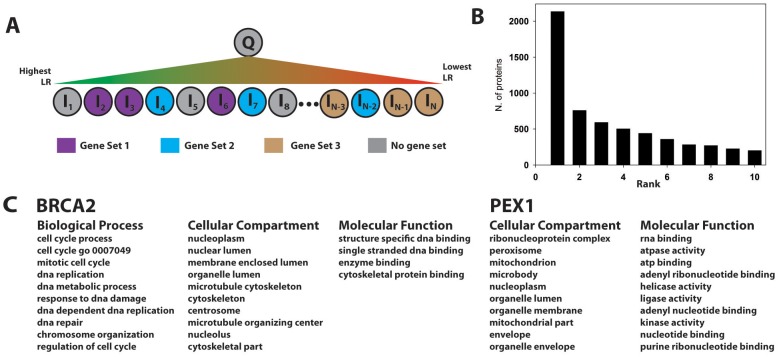
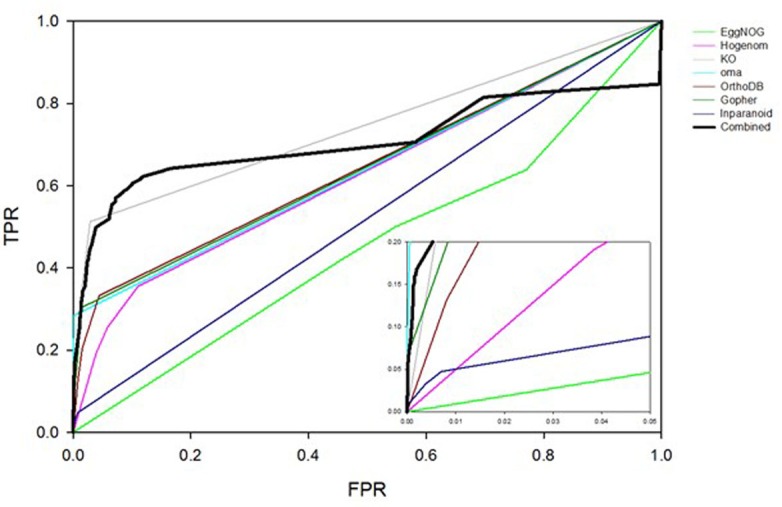
We present a database, PrePPI (Predicting Protein-Protein Interactions), of more than 1.35 million predicted protein-protein interactions (PPIs). Of these at least 127,000 are expected to constitute direct physical interactions although the actual number may be much larger (~500,000). The current PrePPI, which contains predicted interactions for about 85% of the human proteome, is related to an earlier version but is based on additional sources of interaction evidence and is far larger in scope. The use of structural relationships allows PrePPI to infer numerous previously unreported interactions. PrePPI has been subjected to a series of validation tests including reproducing known interactions, recapitulating multi-protein complexes, analysis of disease associated SNPs, and identifying functional relationships between interacting proteins. We show, using Gene Set Enrichment Analysis (GSEA), that predicted interaction partners can be used to annotate a protein's function. We provide annotations for most human proteins, including many annotated as having unknown function.

Keywords: computational biology; function annotation; human; machine learning; protein interactions; systems biology.


Conflict of interest statement

The authors declare that no competing interests exist.

Figures

Figure 1.
Figure 1.. Overview of PrePPI prediction evidence and methodology.
Each box represents a type of interaction evidence used in PrePPI. Those titled with a green background use structural information and those with a blue background do not. Contained in each box is a visual outline of how that type of evidence is used (details are provided in the text and Materials and methods). Overall, an interaction between two given proteins A and B is inferred based on some similarity to others that are known to interact (yellow double arrows) or if they have other properties that correlate in some way (orange double arrows). A red 'X' indicates that an interaction between two proteins does not exist. DOI: http://dx.doi.org/10.7554/eLife.18715.002
Figure 2.
Figure 2.. PrePPI prediction performance.
(a) ROC curves assessing PrePPI prediction performance using different reference sets. The y-axis shows the fraction of interactions recovered from a positive reference set (TPR, true positive rate) vs. the fraction recovered from a corresponding negative reference set (FPR, false positive rate). The solid grey and black lines are based on the human HC and N reference sets defined in Materials and methods and compare performance based only on the sources of evidence used in the previous version of PrePPI (grey) and incorporating the new sources of evidence (black). The dashed lines are based on the PRS/RRS reference sets described in the text. The inset shows recovery in the low FPR region. (b) Fraction of PRS (solid line) and RRS (dashed line) interactions recovered with an LR above the cutoff shown on the x-axis. Solid horizontal lines show the fraction of the PRS sets recovered by the Y2H (dark purple) and BioPlex (light purple) databases. DOI: http://dx.doi.org/10.7554/eLife.18715.003
Figure 3.
Figure 3.. PrePPI performance with and without homology models.
The red line shows PrePPI performance using only crystal structures available in the PDB for individual proteins. The black line shows the performance if both homology models and crystal structures are used. DOI: http://dx.doi.org/10.7554/eLife.18715.006
Figure 4.
Figure 4.. Predictions between proteins annotated as paralogs of proteins in the template.
Panels (a) and (b) show the numbers of predictions (y-axis) as a function of LR (x-axis). In Panel (a) the LR is based only on the SM term and in Panel (b) is based on all sources of evidence. Panel (c) and (d) show the probability (y-axis) of interactions being in the HC set as a function of LR (x-axis). In Panel (c) the LR is based only the SM score and in Panel (d) it is based on all sources of evidence. DOI: http://dx.doi.org/10.7554/eLife.18715.007
Figure 5.
Figure 5.. Functional relationships of PrePPI predicted interaction partners.
(a) Percentage of pairs of proteins (y-axis) that are predicted to interact and that share the GO biological process term on the x-axis. Green bars are for PrePPI predictions, pink for the STRING database, purple for the human HC reference set, and black bars are for a random set of protein pairs. (b) The solid orange line shows the fraction of CORUM complexes (y-axis) recovered as a function of LR (x-axis). The dashed line shows the recovery of randomly generated complexes with the same number of subunits as those in CORUM. The horizontal lines show the percentage of CORUM complexes recovered by the Y2H (dark purple) and BioPlex (light purple) interaction sets. The vertical line shows the point on the x-axis with LR=600. DOI: http://dx.doi.org/10.7554/eLife.18715.008
Figure 6.
Figure 6.. Gene set enrichment using the PrePPI interactome.
(A) To infer a function for a given protein, Q, all proteins in the human proteome, Ii, are placed in a list and sorted according to the interaction LR between Ii and Q. This list is then searched for gene sets associated with a given GO annotation enriched among the high-scoring interactors of Q. In the example in panel A, Gene Set 1 would be enriched whereas Gene Sets 2 and 3 would not be, since the proteins in those sets are either evenly distributed throughout the ranked list or clustered with proteins that are unlikely to interact with Q. (B) Histogram showing the position, in the list of enriched gene sets, of the first set associated with a known GO annotation for Q. Gene sets are ranked according to their enrichment at the top of LR-ranked list of interactors {Ii} of Q. (C) Top ranked gene sets found for two examples, BRCA2 and PEX1. DOI: http://dx.doi.org/10.7554/eLife.18715.013
Figure 7.
Figure 7.. ROC plots comparing interaction prediction performance based on orthology for individual databases indicated in the legend.
Three bins are defined for any given database, representing whether there 0, 1 or >1 orthologs of two given proteins reported to interact in some other species. LR’s for each bin are trained using the yeast HC and N reference sets of interactions. ROC curves are plotted for the human HC and, for this analysis only, a negative reference set consisting of ~200M pairs of proteins for which there is no literature evidence of an interaction. DOI: http://dx.doi.org/10.7554/eLife.18715.016

References

    1. Altenhoff AM, Škunca N, Glover N, Train CM, Sueki A, Piližota I, Gori K, Tomiczek B, Müller S, Redestig H, Gonnet GH, Dessimoz C. The OMA orthology database in 2015: function predictions, better plant support, synteny view and other improvements. Nucleic Acids Research. 2015;43:D240–D249. doi: 10.1093/nar/gku1158. - DOI - PMC - PubMed
    1. Ashburner M, Ball CA, Blake JA, Botstein D, Butler H, Cherry JM, Davis AP, Dolinski K, Dwight SS, Eppig JT, Harris MA, Hill DP, Issel-Tarver L, Kasarskis A, Lewis S, Matese JC, Richardson JE, Ringwald M, Rubin GM, Sherlock G. Gene ontology: tool for the unification of biology. The Gene Ontology Consortium. Nature Genetics. 2000;25:25–29. doi: 10.1038/75556. - DOI - PMC - PubMed
    1. Auton A, Brooks LD, Durbin RM, Garrison EP, Kang HM, Korbel JO, Marchini JL, McCarthy S, McVean GA, Abecasis GR, The Genomes Project C, 1000 Genomes Project Consortium A global reference for human genetic variation. Nature. 2015;526:68–74. doi: 10.1038/nature15393. - DOI - PMC - PubMed
    1. Beigi F, Schmeckpeper J, Pow-Anpongkul P, Payne JA, Zhang L, Zhang Z, Huang J, Mirotsou M, Dzau VJ. C3orf58, a novel paracrine protein, stimulates cardiomyocyte cell-cycle progression through the PI3K-AKT-CDK7 pathway. Circulation Research. 2013;113:372–380. doi: 10.1161/CIRCRESAHA.113.301075. - DOI - PMC - PubMed
    1. Berman HM, Westbrook J, Feng Z, Gilliland G, Bhat TN, Weissig H, Shindyalov IN, Bourne PE. The protein data bank. Nucleic Acids Research. 2000;28:235–242. doi: 10.1093/nar/28.1.235. - DOI - PMC - PubMed

Publication types