Review
. 2016 Oct;28(5):417-424.
doi: 10.1016/j.smim.2016.10.004. Epub 2016 Oct 19.

Integrating immunometabolism and macrophage diversity

Affiliations
Review

Integrating immunometabolism and macrophage diversity

Maxim N Artyomov et al. Semin Immunol. 2016 Oct.

Abstract

Macrophages are heterogeneous cells that play a key role in inflammatory and tissue reparative responses. Over the past decade it has become clear that shifts in cellular metabolism are important determinants of macrophage function and phenotype. At the same time, our appreciation of macrophage diversity in vivo has also been increasing. Factors such as cell origin and tissue localization are now recognized as important variables that influence macrophage biology. Whether different macrophage populations also have unique metabolic phenotypes has not been extensively explored. In this article, we will discuss the importance of understanding how macrophage origin can modulate metabolic programming and influence inflammatory responses.

Keywords: Glycolysis; Inflammation; Metabolism; Mitochondria; Nitric oxide.


Figures

Figure 1
Figure 1. BMDMs and pMACs have divergent mitochondrial responses to LPS activation
BMDMs or day 4 thioglycollate elicted peritoneal macrophages (pMACs) were plated into 96 well seahorse plates and mitochondrial function was compared using a mitochondrial stress test (oligomycin (10 µM) , FCCP (1.5 µM) , rotenone (100 nM)/antimycin (1µM)) on a seahorse flux analyzer. (A, C) Baseline ECAR was measured 16 h after stimulation with PBS (black) or LPS (red; 100 ng/ml) as an indicator of glycolysis. (B, D) Mitochondrial oxygen consumption (OCR) was quantified 16h after LPS injection at baseline and after the indicated injections. The key observation is that in response to LPS both macrophage types share glycolytic phenotypes but have profoundly different mitochondrial OCR with BMDMs showing suppression and pMACs displaying enhancement of mitochondrial respiration.
Figure 2
Figure 2. TCA reprogramming in LPS activated macrophages
(A, B) Kinetic gene expression analysis for BMDMs (red bars) and pMACs (blue bars) treated with LPS were obtained from available previously published data (ref). The relative expression of Irg1 (A) and IDH (B) for these macrophage subtypes are shown. (C) Schematic diagram of the TCA cycle in pMACs with quantified levels of the indicated metabolites shown. Whole cell concentrations of TCA metabolites were generated from 2×10⁶ pMACs treated with PBS (black bars) or LPS (red bars; 100 ng/ml) in triplicate for 16h. After stimulation, the cells were snap frozen in liquid nitrogen and TCA intermediates were quantified by LC-MS/MS at the Sanford Burnham Prebys metabolomics core (Lake Nona, USA). The enzymatic steps disrupted in the broken TCA cycle induced by LPS occur at IDH1 and SDH and these reactions are indicated by blue text. IDH is transcriptionally suppressed whereas SDH is inhibited by itaconate, a product of the enzyme Irg1. When flux though IDH is reduced, a greater proportion of citrate is diverted out of the mitochondria where it contributes to the cytosolic acetyl-CoA pool and the production of malonyl-CoA via citrate lyase (CL) and acetyl-CoA carboxylase (ACC). Anapleurotic flux into the TCA cycle from glutamine to α-ketoglutarate (α-KG) and the argininoosuccinate shunt to fumarate, which can maintain TCA function, are indicated with the blue arrows.
Figure 3
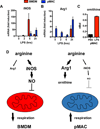
Figure 3. Nitric oxide in the suppression of macrophage mitochondrial respiration
(A, B) Kinetic gene expression of iNOS and arginase 1 (Arg1) in BMDMs (red bars) and pMACs (blue bars) illustrates delayed induction of iNOS and higher expression of Arg1 in pMACs. (C) Consistent with increased arginase activity, pMACs demonstrate a significant increase in ornithine production upon LPS activation. (D) This profile suggests a model in which arginine metabolism favors iNOS in BMDMs and Arg1 in pMACs. The net effect of this shift is to reduce NO release and increased mitochondrial respiration in LPS stimulated pMACs, whereas high level NO production in BMDMs suppresses mitochondrial function.
Figure 4
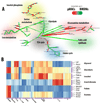
Figure 4. Metabolic-transcriptional profiling of diverse tissue macrophages
(A) Metabo-transcriptional network representing differences between BMDM and pMACs based on the gene expression data from Immgen Consortium. Edges are colored according to specificity of enzyme expression – green implies upregulation of corresponding enzymes in BMDMs, and red – in pMACs. (B) Metabo-transcriptional clustering of the multiple resident macrophage types profiled in Immgen reveals the metabolic modules differentially regulated in different tissue macrophages.

References

    1. Loftus RM, Finlay DK. Immunometabolism: Cellular Metabolism Turns Immune Regulator. The Journal of biological chemistry. 2016;291:1–10. - PMC - PubMed
    1. Lampropoulou V, et al. Itaconate Links Inhibition of Succinate Dehydrogenase with Macrophage Metabolic Remodeling and Regulation of Inflammation. Cell metabolism. 2016;24:158–166. - PMC - PubMed
    1. O'Neill LA, Pearce EJ. Immunometabolism governs dendritic cell and macrophage function. The Journal of experimental medicine. 2016;213:15–23. - PMC - PubMed
    1. Odegaard JI, Chawla A. Alternative macrophage activation and metabolism. Annual review of pathology. 2011;6:275–297. - PMC - PubMed
    1. Jha AK, et al. Network integration of parallel metabolic and transcriptional data reveals metabolic modules that regulate macrophage polarization. Immunity. 2015;42:419–430. - PubMed

Publication types