

The interaction between physical activity and obesity gene variants in association with BMI: Does the obesogenic environment matter?
- PMID: 27771443
- PMCID: PMC5116401
- DOI: 10.1016/j.healthplace.2016.09.003
The interaction between physical activity and obesity gene variants in association with BMI: Does the obesogenic environment matter?
Abstract
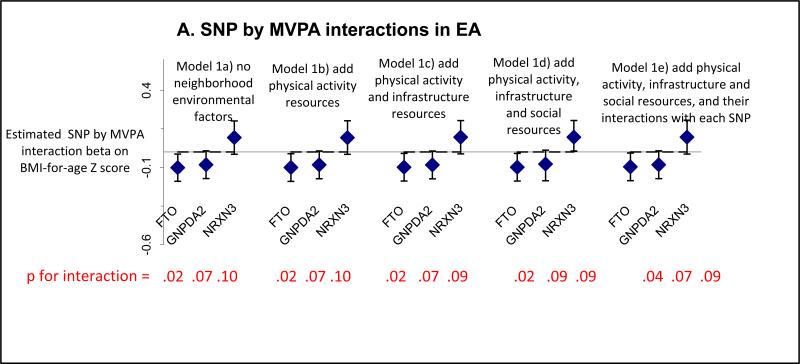
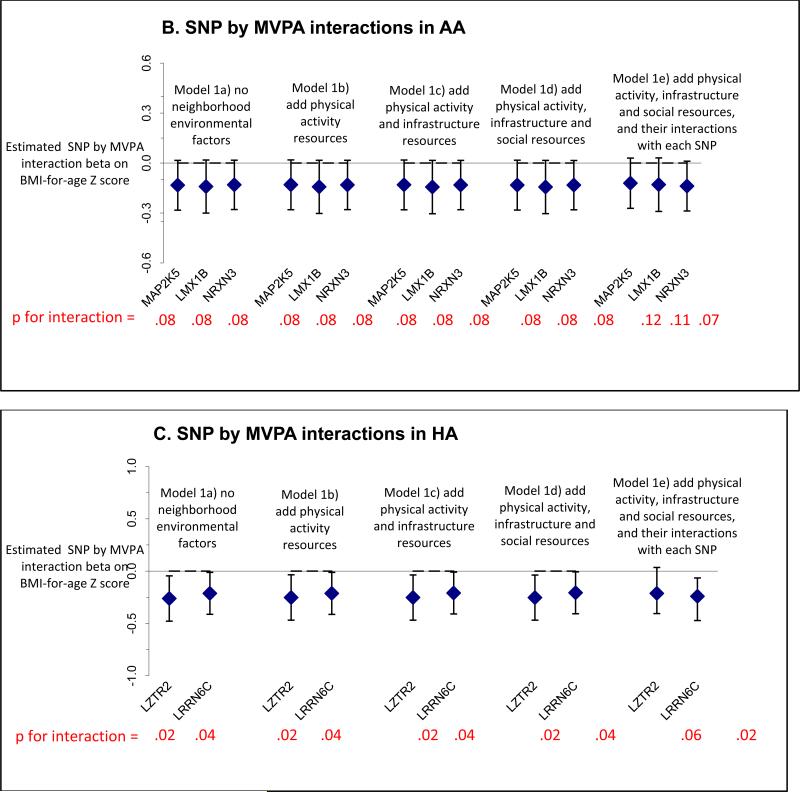
Little is known about how obesity susceptibility single nucleotide polymorphisms (SNPs) interact with moderate to vigorous physical activity (MVPA) in relation to BMI during adolescence, once obesogenic neighborhood factors are accounted for. In race stratified models, including European (EA; N=4977), African (AA; N=1726), and Hispanic Americans (HA; N=1270) from the National Longitudinal Study of Adolescent to Adult Health (1996; ages 12-21), we assessed the evidence for a SNPxMVPA interaction with BMI-for-age Z score, once accounting for obesogenic neighborhood factors including physical activity amenities, transportation and recreation infrastructure, poverty and crime. Eight SNPxMVPA interactions with suggestive significance (p<0.10; three in each EA, and AA, two in HA) were observed showing attenuation on BMI-for-age Z score in adolescents with ≥5 versus <5 bouts/week MVPA, except for rs10146997 (near NRXN3). Findings were robust to the inclusion of neighborhood-level variables as covariates. These findings suggest that any attenuation from MVPA on a genetic susceptibility to obesity during adolescence is likely not operating through obesogenic neighborhood factors.
Keywords: Adolescence; African and Hispanic American; BMI; Genetics of obesity; Physical activity.
Copyright © 2016 Elsevier Ltd. All rights reserved.
Figures
Similar articles
-
Moderate to vigorous physical activity interactions with genetic variants and body mass index in a large US ethnically diverse cohort.Pediatr Obes. 2014 Apr;9(2):e35-46. doi: 10.1111/j.2047-6310.2013.00152.x. Epub 2013 Mar 25. Pediatr Obes. 2014. PMID: 23529959 Free PMC article.
-
Associations of Neighborhood Safety and Neighborhood Support with Overweight and Obesity in US Children and Adolescents.Ethn Dis. 2016 Oct 20;26(4):469-476. doi: 10.18865/ed.26.4.469. Ethn Dis. 2016. PMID: 27773973 Free PMC article.
-
Income, Race and its Association with Obesogenic Behaviors of U.S. Children and Adolescents, NHANES 2003-2006.J Community Health. 2019 Jun;44(3):507-518. doi: 10.1007/s10900-018-00613-6. J Community Health. 2019. PMID: 30659412 Free PMC article.
-
Physical activity as a mediator linking neighborhood environmental supports and obesity in African Americans in the path trial.Health Psychol. 2014 May;33(5):481-9. doi: 10.1037/a0032758. Epub 2013 May 13. Health Psychol. 2014. PMID: 23668847 Free PMC article. Clinical Trial.
-
Relations of Neighborhood Environment Influences, Physical Activity, and Active Transportation to/from School across African American, Latino American, and White Girls in the United States.Int J Behav Med. 2016 Apr;23(2):153-61. doi: 10.1007/s12529-015-9508-9. Int J Behav Med. 2016. PMID: 26377829 Free PMC article.
Cited by
-
Systemic F2-Isoprostane Levels in Predisposition to Obesity and Type 2 Diabetes: Emphasis on Racial Differences.Divers Equal Health Care. 2017;14(2):91-101. doi: 10.21767/2049-5471.100098. Epub 2017 Apr 10. Divers Equal Health Care. 2017. PMID: 32523692 Free PMC article.
-
Influence of Neighborhood Environment on Korean Adult Obesity Using a Bayesian Spatial Multilevel Model.Int J Environ Res Public Health. 2019 Oct 18;16(20):3991. doi: 10.3390/ijerph16203991. Int J Environ Res Public Health. 2019. PMID: 31635403 Free PMC article.
-
Achieved educational attainment, inherited genetic endowment for education, and obesity.Biodemography Soc Biol. 2021 Apr-Jun;66(2):132-144. doi: 10.1080/19485565.2020.1869919. Biodemography Soc Biol. 2021. PMID: 34182851 Free PMC article.
-
The genomic landscape of African populations in health and disease.Hum Mol Genet. 2017 Oct 1;26(R2):R225-R236. doi: 10.1093/hmg/ddx253. Hum Mol Genet. 2017. PMID: 28977439 Free PMC article. Review.
-
Genetic risk of obesity as a modifier of associations between neighbourhood environment and body mass index: an observational study of 335 046 UK Biobank participants.BMJ Nutr Prev Health. 2020 Oct 5;3(2):247-255. doi: 10.1136/bmjnph-2020-000107. eCollection 2020 Dec. BMJ Nutr Prev Health. 2020. PMID: 33521535 Free PMC article.
References
-
- Andreasen CH, Stender-Petersen KL, et al. Low physical activity accentuates the effect of the FTO rs9939609 polymorphism on body fat accumulation. Diabetes. 2008;57(1):95–101. - PubMed
-
- Block JP, Scribner RA, et al. Fast food, race/ethnicity, and income: a geographic analysis. Am J Prev Med. 2004;27(3):211–217. - PubMed
Publication types
MeSH terms
Grants and funding
LinkOut - more resources
Full Text Sources
Other Literature Sources
Medical
