. 2017 Feb;6(1):e00414.
doi: 10.1002/mbo3.414. Epub 2016 Oct 22.

Expanding the archaellum regulatory network - the eukaryotic protein kinases ArnC and ArnD influence motility of Sulfolobus acidocaldarius

Affiliations

Expanding the archaellum regulatory network - the eukaryotic protein kinases ArnC and ArnD influence motility of Sulfolobus acidocaldarius

Lena Hoffmann et al. Microbiologyopen. 2017 Feb.

Abstract

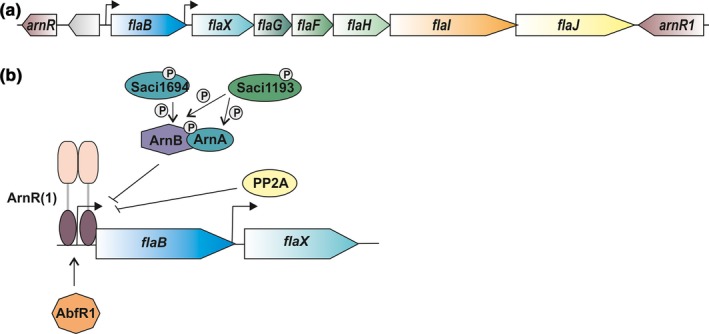
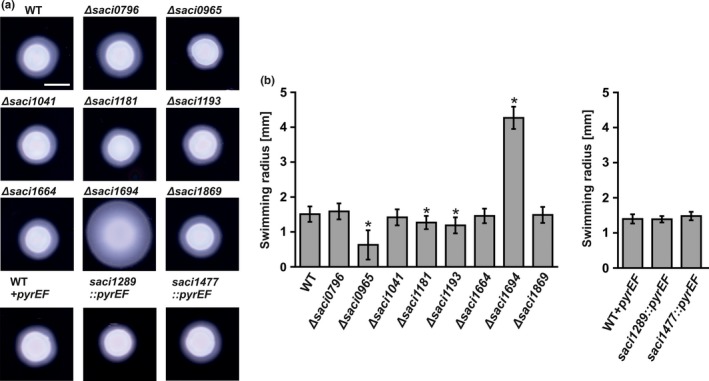
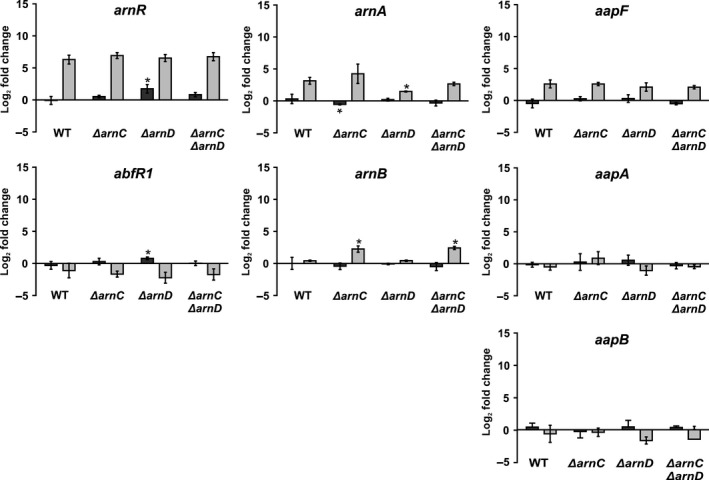
Expression of the archaellum, the archaeal-type IV pilus-like rotating motility structure is upregulated under nutrient limitation. This is controlled by a network of regulators, called the archaellum regulatory network (arn). Several of the components of this network in Sulfolobus acidocaldarius can be phosphorylated, and the deletion of the phosphatase PP2A results in strongly increased motility during starvation, indicating a role for phosphorylation in the regulation of motility. Analysis of the motility of different protein kinase deletion strains revealed that deletion of saci_0965, saci_1181, and saci_1193 resulted in reduced motility, whereas the deletion of saci_1694 resulted in hypermotility. Here ArnC (Saci_1193) and ArnD (Saci_1694) are characterized. Purified ArnC and ArnD phosphorylate serine and threonine residues in the C-terminus of the repressor ArnB. arnC is upregulated in starvation medium, whereas arnD is constitutively expressed. However, while differences in the expression and levels of flaB were observed in the ΔarnD strain during growth under rich conditions, under nutrient limiting conditions the ΔarnC and ΔarnD strains showed no large differences in the expression levels of the archaellum or of the studied regulators. This suggests that next to the regulation via the archaellum regulatory network additional regulatory mechanisms of expression and/or activity of the archaellum exist.

Keywords: S. acidocaldarius; archaeal flagella; archaellum regulation; phosphorylation; protein kinases; signaling network.


Figures

Figure 1
Figure 1
Archaellum operon and archaellum regulatory network. (a) The operon from flaB to flaJ encodes the subunits of the archaellum of S. acidocaldarius. Upstream and downstream of the operon, the activators arnR and arnR1 are encoded. (b) Model of the archaellum regulatory network (arn) and the proteins involved in archaellum expression during starvation. The repressors ArnA and ArnB are phosphorylated by ePKs and interact to block expression if nutrients are present. The phosphatase Saci_PP2A also represses expression of the archaellin FlaB. During starvation, the positive regulators ArnR and ArnR1 activate expression by binding to the flaB promoter. Additionally, the biofilm regulator AbfR1 contributes to stimulation of archaellum expression (adapted from Albers & Jarrell, 2015)
Figure 2
Figure 2
Effect of S. acidocaldarius kinase deletion strains on motility. Motility assays were performed on semisolid plates. (a) Motility plates containing the pyrEF deletion strain MW001 (WT) or pyrEF insertion strain (WT + pyrEF) and the kinases deletion strains constructed in the respective background. (b) Average swimming radius calculated from three biological replicates containing each at least six technical replicates. Scale bar 5 mm. Statistical significance for (b) was compared to the WT and WT + pyrEF using a Student's t‐test and is indicated by asterisks (p ≤ 0.05)
Figure 3
Figure 3
arnC and arnD deletion mutants are affected in motility. Motility assay were performed on semisolid plates. (a) Motility plates containing the pyrEF deletion strain MW001 (WT) and MW001 derivatives containing ΔaapF, ΔarnRΔarnR1, ΔarnC, ΔarnD, and ΔarnCΔarnD. (b) Average swimming radius calculated from three biological replicates containing each at least six technical replicates. (c) Motility assay of the strains shown in (a). carrying either pSVA1561 (S. acidocaldarius expression vector) or pSVA1561 containing arnC‐HA or arnD‐HA under the control of their native promoters. HA indicates a C‐terminal HA‐tag. (d) Average swimming radius calculated from three biological replicates containing each at least six technical replicates. Scale bar; 5 mm. Statistical significance for (b) and (d) was compared to the WT using a Student's t‐test and is indicated by asterisks (p ≤ 0.05)
Figure 4
Figure 4
ArnB is phosphorylated by ArnC and ArnD on serine and threonine residues. (a) 1 μg of ArnB was incubated with 20 ng (light gray bars) or 2 ng (dark gray bars) ArnC or (b) ArnD, and phosphorylated peptides were determined by mass spectrometry. Normalized intensities of different phosphopeptides are depicted. The average of three replicates is depicted (c) Sequence of ArnB annotated with phosphorylation sites detected with ≥75 % probability. Residues detected after phosphorylation with ArnC only (blue), ArnD only (yellow) and the ones that were detected in both assays (green) are highlighted. The annotated MSMS spectra and tables used for the calculation of the phosphorylation intensity are available as Supporting file 1 (pdf: Annotated MSMS spectra of phosphorylated ArnB peptides) and Supporting file 2 (excel file: Quantitative MS data from in vitro kinases assays)
Figure 5
Figure 5
Analysis of the expression of arnC and arnD during growth on rich and starvation medium. (a) Samples of S. acidocaldarius were grown in rich medium, centrifuged and then transferred to either rich or starvation conditions and mRNA levels of arnC and arnD and were determined by qRTPCR at different time‐points. The increase in expression in the starvation medium compared to the rich medium is shown. Bars show the mean value of three independent biological replicates with each four technical replicates. (b) Western blot of the levels of ArnC‐HA and ArnD‐HA in the cytoplasm (C) and the membrane (M) after 4 hr of growth under rich (+) and starvation (‐) conditions. The membranes were concentrated 3.3‐fold compared to the cytoplasmic fraction. Proteins were detected using an antibody directed against the HA‐tag. The figure shows a representative blot of three independent replicates
Figure 6
Figure 6
Expression and protein levels of FlaB and FlaX in rich and starvation medium. S. acidodaldarius was grown to an OD 600 of 0.4 in rich medium and transferred to either rich or starvation medium and samples for total RNA extraction and Western blot were collected. (a) Relative gene expression levels of flaB after 0.5 hr, 1 hr, 1.5 hr, 2 hr and 4 hr growth in rich medium compared to t = 0 of the WT (white bars) and the ΔarnC (gray bars), ΔarnD (light gray, dashed bars), and ΔarnCΔarnD (dark gray, dashed bars) strains. (b) Western blots of FlaB in whole cells grown in rich medium. Proteins were detected using an antibody directed against FlaB. A representative blot of at least three independent replicates is shown. (c) Relative gene expression levels of flaB after 0.5 hr, 1 hr, 1.5 hr, 2 hr and 4 hr growth in starvation medium compared to t = 0 of the WT (white bars) and the ΔarnC (gray bars), ΔarnD (light gray, dashed bars), and ΔarnCΔarnD (dark gray, dashed bars) strains. (d) Western blots of FlaB in whole cells grown in starvation medium. Proteins were detected using an antibody directed against FlaB. A representative blot of at least three independent replicates is shown. (e) Relative gene expression levels of flaX after 4 hr of growth in rich medium (dark gray bars) and starvation medium (light gray bars) compared to t = 0 of the WT and the ΔarnC, ΔarnD, and ΔarnCΔarnD strains. (f). Western blots of FlaX in whole cells grown in starvation medium and rich medium for 4 hr. Proteins were detected using an antibody directed against FlaX. A representative blot of at least three independent replicates is shown. Bars in (a), (c), and (e) represent the mean values of three independent biological replicates with each four technical replicates. Values that are significantly different compared to the WT (Student's t‐test, p ≤ 0.05) are indicated by asterisks
Figure 7
Figure 7
Expression of archaellum regulators and adhesive pilus genes in the WT and ΔarnC, ΔarnD, and ΔarnCΔarnD strains. Total RNA was extracted from cells that were grown to an OD 600 of 0.4 and subsequently shifted to either rich or starvation medium. Relative gene expression levels of arnR, abfR1, arnA, arnB, aapA, and aapF in rich (dark gray bars) and starvation medium (light gray bars) compared to t = 0 in each strain. Bars represent mean values of three independent biological replicates with each four technical replicates. Values that are significantly different compared to the WT (Student's t‐test, p ≤ 0.05) are indicated by asterisks

References

    1. Albers, S.‐V. , & Jarrell, K. F. (2015). The archaellum: how archaea swim. Frontiers in Microbiology, 6, 1–12. - PMC - PubMed
    1. Ashby, M. K. (2006). Distribution, structure and diversity of “bacterial “genes encoding two‐component proteins in the Euryarchaeota. Archaea, 2, 11–30. - PMC - PubMed
    1. Berkner, S. , Wlodkowski, A. , & Lipps, S. A. G. (2010). Inducible and constitutive promoters for genetic systems in Sulfolobus acidocaldarius . Extremophiles, 14, 249–259. - PMC - PubMed
    1. Briza, P. , Bogengruber, E. , Thu, A. , Ru, M. , Mu, M. , & Breitenbach, M. (2002). Systematic analysis of sporulation phenotypes in 624 non‐lethal homozygous deletion strains of Saccharomyces cerevisiae . Yeast, 19, 403–422. - PubMed
    1. Brock, T. D. , Brock, K. M. , Belly, R. T. , & Weiss, R. L. (1972). Sulfolobus: A new genus of sulfur‐oxidizing bacteria living at low pH and high temperature. Archiv für Mikrobiologie, 84, 54–68. - PubMed

Publication types