

Population Structure of UK Biobank and Ancient Eurasians Reveals Adaptation at Genes Influencing Blood Pressure
- PMID: 27773431
- PMCID: PMC5097941
- DOI: 10.1016/j.ajhg.2016.09.014
Population Structure of UK Biobank and Ancient Eurasians Reveals Adaptation at Genes Influencing Blood Pressure
Abstract
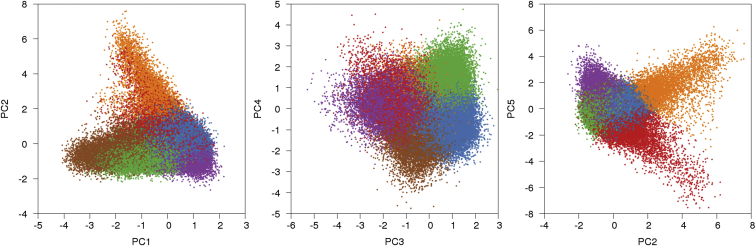
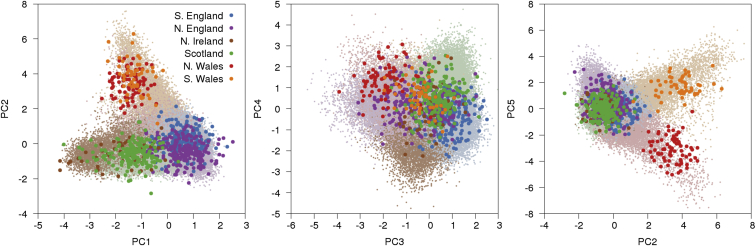
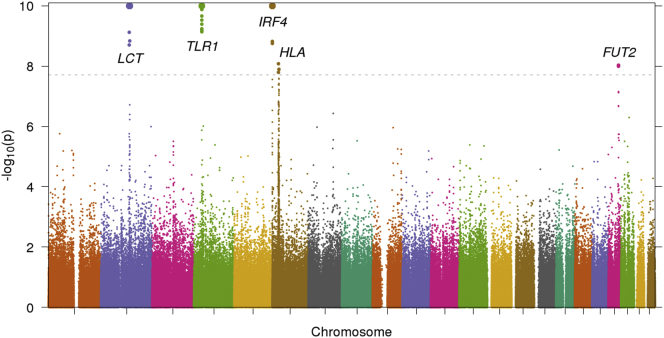
Analyzing genetic differences between closely related populations can be a powerful way to detect recent adaptation. The very large sample size of the UK Biobank is ideal for using population differentiation to detect selection and enables an analysis of the UK population structure at fine resolution. In this study, analyses of 113,851 UK Biobank samples showed that population structure in the UK is dominated by five principal components (PCs) spanning six clusters: Northern Ireland, Scotland, northern England, southern England, and two Welsh clusters. Analyses of ancient Eurasians revealed that populations in the northern UK have higher levels of Steppe ancestry and that UK population structure cannot be explained as a simple mixture of Celts and Saxons. A scan for unusual population differentiation along the top PCs identified a genome-wide-significant signal of selection at the coding variant rs601338 in FUT2 (p = 9.16 × 10⁻⁹). In addition, by combining evidence of unusual differentiation within the UK with evidence from ancient Eurasians, we identified genome-wide-significant (p = 5 × 10⁻⁸) signals of recent selection at two additional loci: CYP1A2-CSK and F12. We detected strong associations between diastolic blood pressure in the UK Biobank and both the variants with selection signals at CYP1A2-CSK (p = 1.10 × 10⁻¹⁹) and the variants with ancient Eurasian selection signals at the ATXN2-SH2B3 locus (p = 8.00 × 10⁻³³), implicating recent adaptation related to blood pressure.
Copyright © 2016 American Society of Human Genetics. Published by Elsevier Inc. All rights reserved.
Figures

References
-
- Sabeti P.C., Reich D.E., Higgins J.M., Levine H.Z.P., Richter D.J., Schaffner S.F., Gabriel S.B., Platko J.V., Patterson N.J., McDonald G.J. Detecting recent positive selection in the human genome from haplotype structure. Nature. 2002;419:832–837. - PubMed
MeSH terms
Grants and funding
LinkOut - more resources
Full Text Sources
Other Literature Sources
Miscellaneous
