. 2016 Nov 7;39(3):346-358.
doi: 10.1016/j.devcel.2016.09.023. Epub 2016 Oct 20.

Apical Sarcomere-like Actomyosin Contracts Nonmuscle Drosophila Epithelial Cells

Affiliations

Apical Sarcomere-like Actomyosin Contracts Nonmuscle Drosophila Epithelial Cells

Jonathan S Coravos et al. Dev Cell. .

Abstract

Actomyosin networks generate contractile force that changes cell and tissue shape. In muscle cells, actin filaments and myosin II appear in a polarized structure called a sarcomere, in which myosin II is localized in the center. Nonmuscle cortical actomyosin networks are thought to contract when nonmuscle myosin II (myosin) is activated throughout a mixed-polarity actin network. Here, we identified a mutant version of the myosin-activating kinase, ROCK, that localizes diffusely, rather than centrally, in epithelial cell apices. Surprisingly, this mutant inhibits constriction, suggesting that centrally localized apical ROCK/myosin activity promotes contraction. We determined actin cytoskeletal polarity by developing a barbed end incorporation assay for Drosophila embryos, which revealed barbed end enrichment at junctions. Our results demonstrate that epithelial cells contract with a spatially organized apical actomyosin cortex, involving a polarized actin cytoskeleton and centrally positioned myosin, with cell-scale order that resembles a muscle sarcomere.

Keywords: ROCK; actin cortex; cell polarity; contraction; epithelia; morphogenesis; myosin; sarcomere.


Figures

Figure 1
Figure 1. Diffuse apical ROCK is insufficient for tissue folding
(A) Models for actomyosin contraction. (B) Apical surfaces of ventral furrow cells in embryos expressing the indicated Venus-tagged rock transgenes in the presence of endogenous wild-type ROCK. SBD = Shroom-binding domain, RBD = RhoA binding domain, PH = pleckstrin homology. Shaded region indicates deleted region in ROCKΔ547-923. (C) Apical surfaces of ventral furrow cells with ROCKwt or ROCKΔ547-923 expressed in rock2 null mutant background. (D) Cross-section views of the ventral side of embryos. Yellow dashed lined represents the embryo surface. Embryos were aligned in time by the onset of ROCK accumulation. The ventral domain appears smaller in rockwt because cells have contracted their apical area. (E) Cross-sections of fixed embryos stained for myosin heavy chain (Myo) and Neurotactin (Membrane). Genotypes are the rock2 null mutant or the rock2 mutant expressing either rockwt or rockΔ547-923. Arrowheads indicate apical myosin specific for ventral domain. (F) Apical surface views of rockwt or rockΔ547-923 expressed in rock2 null background and immunostaining of myosin heavy chain. Arrows show polarized myosin. (G) Recoil distance of fluorescent ROCK signal away from laser cut in ventral furrow epithelium after laser ablation at t = 0. In the pre-network myosin condition, the ablation was performed in wild-type embryos expressing RLC::GFP, which was used instead of ROCK fluorescence to track recoil distance. n is cuts per condition, and bars represent ± 1 s.d. (H) Initial recoil velocity following (~ 300 ms) laser ablation in RLC::GFP embryos prior to (pre-network myosin) or after (network myosin) the establishment of the supracellular myosin network. Initial recoil velocity was also measured in rock2 germline clones expressing either rockwt or rockΔ547-923. From left to right, n = 7, 6, 19, 22 cuts. Red bars represent median. Comparisons were performed with the Kruskal-Wallis test. Images B-D were separately contrast adjusted to illustrate intracellular distribution of ROCK. Scale bars = 5 μm (B,C,E,F), 10 μm (D). See also Figure S1.
Figure 2
Figure 2. Diffuse ROCK dominantly inhibits apical constriction and tissue folding
(A) Apical surfaces of embryos expressing Venus::ROCKwt, Venus::ROCKΔ547-923, or Venus::ROCKK(116)A, Δ547-923 transgenes in wild-type rock background. (B) Quantification of apical area contraction rate in embryos expressing rock variants from (A) with the maternal Gal4 drivers, mat15 or mat67. For each condition, from left to right n = 90, 104, 122 cells and 2 embryos. Red line is median, box represents 25th-75th percentile, and whiskers represent ± 2.7 s.d.. Statistical comparisons were made with the Kruskal-Wallis test. (C) Cross-sections of live embryos with the same genotypes as (A). Dashed yellow line indicates the apical surface of the embryo. Embryos were aligned in time by onset of ROCK accumulation. (D) Quantification of normalized intensity distribution of Venus::ROCKwt, Venus::ROCKΔ547-923, and Venus::ROCKK(116)A, Δ547-923 from cell centroid to the cell junction (radial distance). Solid lines represent mean, and dashed lines represent ± 1 s.d.. Each plot represents cells quantified from one representative embryo. (E) Apical myosin localization (RLC::mCherry) in rock mutants expressed in a wild-type background. ROCK and myosin colocalize in foci for rockwt and rockK(116)A, Δ547-923 (arrowheads). In A,C,E, images were separately contrast adjusted to illustrate intracellular distribution of ROCK, but not myosin. Scale bars = 5μm (A,C,E). See also Figure S1.
Figure 3
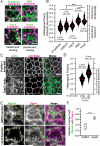
Figure 3. The apical actin cortex in ventral furrow cells is polarized with pointed ends enriched medioapically and barbed ends enriched at junctions
(A) Apical surfaces of fixed embryos stained with antibodies against indicated proteins or a tmod::GFP transgenic line. Arrowheads indicate junctional staining of E-cadherin and Cap-α structures. Arrows indicate medioapical MBS and tmod. MBS and tmod staining were performed in the same embryos to determine relative localization. Junctions were identified using subapical E-cadherin or F-actin. (B) Medioapical polarity or mean medioapical intensity minus mean junctional intensity (positive value means medioapical enrichment). Red crosses represent medians, and the dotted red line indicates no enrichment in either the medioapical or junctional domains. Statistical comparisons were made with Kruskal-Wallis. emb. = number of embryos analyzed, and cell = total number of cells analyzed. (C) Apical surface of embryos that were fixed minutes after injection with mixture of actin-488 and profilin. Bottom images show total F-actin (Utr::GFP) for comparison. (D) Medioapical polarity in white-RNAi (control) and dia-RNAi knock-down embryos injected with actin-488 fluorescence. Red crosses indicate median, and emb. = number of embryos analyzed, and cell = total number of cells analyzed. Statistical comparison with Wilcoxon Rank Sum, distributions differ significantly, α = 0.01. (E) RLC::GFP embryos fixed and stained for Cap-α that were injected with DMSO or CytoD (250 μg/mL in DMSO). White dashed circles highlight myosin and yellow dashed lines highlight junctions. (F) Manders overlap coefficient for myosin colocalization with Cap-α after Costes thresholding. Each data point corresponds to the ventral domain of 1 embryo. n = 6 embryos for each condition. Red line is median, box represents 25th-75th percentile, and whiskers represent ± 2.7 s.d.. Statistical comparison with Wilcoxon Rank Sum. Scale bars = 2 μm (A,E), 5 μm (C). See also Figure S2.
Figure 4
Figure 4. ROCK activity continuously stabilizes apical myosin and sustains apical constriction
(A-C) Apical surfaces of cells in a live embryo expressing RLC::GFP (myosin regulatory light chain) and Gap43::mCherry (membranes). Water injection occurs at t = 0. (B) Myosin fluorescence intensity and apical area for the cell marked in (asterisk, A). Blue vertical line indicates the injection time. (C) Mean myosin intensity and apical area (n=164 cells, 3 embryos). Dark lines are means, and shaded areas are ± 1 s.d. (D-F) Same as (A-C) but with ROCK inhibitor (Y-27632, 50 mM). In (F), mean myosin intensity and apical area (n = 259 cells, 3 embryos). (G) Water injection and (H) ROCK inhibitor injection into embryos expressing myosin RLC phosphomutants. RLCTS::GFP and RLCAE::GFP were expressed in a RLC hypomorphic mutant background (sqh1 germline clones). RLCTS is the wild-type protein, and RLCAE is a possible phosphomimetic mutant. (I) Quantification of contraction rate in embryos from the indicated conditions. Red line is median, box represents 25th-75th percentile, and whiskers represent ± 2.7 s.d.. From left to right n = 2 embryos and 188 cells, 3 embryos and 217 cells, 3 embryos and 208 cells, 3 embryos and 195 cells. Statistical comparison calculated with Kruskal-Wallis. Scale bars = 2 μm (A,D,G,H). See also Figure S3.
Figure 5
Figure 5. ROCK continuously maintains ROCK medioapical polarity and medioapical F-actin
(A) Surface views of ventral cells in embryo expressing GFP::ROCK and Gap43::mCherry injected with water after t = 0. (B) Dark lines represent means, and shaded areas indicate ± 1 s.d. (n = 90 cells, 2 embryos).. (C,D) Same as (A,B) but with ROCK inhibitor (Y-27632, 50 mM solution) injection (n = 177 cells, 3 embryos).) (E) Surface views of ventral furrow cells expressing Utr::GFP (F-actin), and Gap43::mCherry (membranes) injected with water after the t = 0 second frame. (F) Total F-actin intensity and ratio of mean peripheral (1 μm-thick outer shell) to mean medioapical F-actin in asterisk-marked cell from (E). Blue vertical line indicates the time of injection. (G) Mean F-actin intensity and the ratio of peripheral F-actin intensity to medioapical intensity before and after injection (n = 240 cells, 3 embryos). Dark lines represent means, and shaded areas indicate ± 1 s.d. (H-J) Same as (E-G) but with ROCK inhibitor injection. ROCK inhibitor acutely disrupts medioapical F-actin (asterisk, H). In (J), n = 150 cells, 2 embryos. Scale bars = 2 μm (A,C,E,H). See also Figures S3 and S4.
Figure 6
Figure 6. ROCK localization to medioapical foci requires the actin cytoskeleton and Dia
(A) Apical views of ventral furrow cells in embryos expressing ubi-GFP::ROCK, Gap43::mCherry (Membrane) or GFP::ROCK, Utr::mCherry (F-actin) and injected with DMSO after 0 sec time point. (B) Same as (A) but with Latrunculin B injection. Disrupted ROCK polarity (white outline and arrow). (C) Apical ROCK in wild-type and maternal dia5 mutant ventral cells. Scale bars = 2 μm (A,B), 5 μm (C). See also Figure S5.
Figure 7
Figure 7. Model of apical constriction mechanism in ventral furrow cells
(A) Illustration of actin filament polarity and ROCK myosin localization during apical constriction. We term this organization a “radial sarcomere”. (B) Illustration of muscle fiber (or myofibril). (C) Illustration of ventral furrow tissue, where contractile units/cells are linked at the junctions (red lines, ROCK image) and operate together to contract and deform the epithelium.

Comment in

Similar articles

Cited by

References

    1. Amano M, Ito M, Kimura K, Fukata Y, Chihara K, Nakano T, Matsuura Y, Kaibuchi K. Phosphorylation and Activation of Myosin by Rho-associated Kinase (Rho-kinase). Journal of Biological Chemistry. 1996;271:20246–20249. - PubMed
    1. Amândio AR, Gaspar P, Whited JL, Janody F. Subunits of the Drosophila Actin-Capping Protein Heterodimer Regulate Each Other at Multiple Levels. PLoS ONE. 2014;9:e96326. - PMC - PubMed
    1. Backouche F, Haviv L, Groswasser D, Bernheim-Groswasser A. Active gels: dynamics of patterning and self-organization. Phys Biol. 2006;3:264–273. - PubMed
    1. Bai J, Hartwig JH, Perrimon N. SALS, a WH2-domain-containing protein, promotes sarcomeric actin filament elongation from pointed ends during Drosophila muscle growth. Developmental Cell. 2007;13:828–842. - PubMed
    1. Barrett K, Leptin M, Settleman J. The Rho GTPase and a Putative RhoGEF Mediate a Signaling Pathway for the Cell Shape Changes in Drosophila Gastrulation. Cell. 1997;91:905–915. - PubMed

Publication types